Support our educational content for free when you purchase through links on our site. Learn more
🚀 12+ AI Framework KPIs: The Ultimate 2026 Efficiency Guide
Ever built an AI model that scored 9% on accuracy but crashed your server every time a user asked a simple question? We’ve been there. It’s the classic tale of a brilliant brain trapped in a sluggish body. At ChatBench.org™, we’ve watched countless teams obsess over model quality while completely ignoring the system quality KPIs that actually determine if their AI can survive in the real world. It’s like buying a Ferrari engine and putting it in a go-kart; sure, it has power, but it’s never going to win the race.
In this deep dive, we’re tearing down the wall between theoretical benchmarks and operational reality. We’ll dissect the 12+ critical performance indicators you need to evaluate AI framework efficiency, from the microscopic details of token throughput to the macroscopic impact of carbon footprints. We’ll reveal why some companies are seeing a 40% drop in costs simply by optimizing their latency metrics, and we’ll answer the burning question: When AI writes the code, who reviews it? Spoiler alert: It’s not just about the code; it’s about the human-in-the-loop.
Key Takeaways
- Holistic Evaluation is Non-Negotiable: True AI framework efficiency requires balancing Model Quality KPIs (accuracy, hallucination rates) with System Quality KPIs (latency, throughput, VRAM utilization) and Business Operational KPIs (TCO, time-to-value).
- Speed Isn’t Everything: While latency and tokens per second are vital, ignoring energy efficiency and cost per inference can lead to unsustainable scaling and balloning operational costs.
- The Human Factor Matters: Even the most advanced AI agents require robust human-in-the-loop intervention strategies to maintain error rates within acceptable limits and ensure ethical alignment.
- Context Dictates Metrics: There is no “one-size-fits-all” benchmark; your KPIs must be tailored to your specific use case, whether it’s real-time chatbots, batch image generation, or complex agentic workflows.
Table of Contents
- ⚡️ Quick Tips and Facts
- 🕰️ A Brief History of AI Benchmarking: From Turing to Transformers
- 🧠 The Core Metrics: Decoding Model Quality KPIs
- 1. Accuracy, Precision, and Recall: The Holy Trinity of Classification
- 2. F1 Score and AUC-ROC: Balancing the Scales
- 3. Perplexity and BLEU: Measuring Language Fluency and Generation
- 4. Hallucination Rates and Factuality Scores
- ⚙️ Under the Hood: System Quality KPIs for Framework Efficiency
- 1. Latency and Response Time: The Race Against the Clock
- 2. Throughput and Tokens Per Second: How Fast Can It Go?
- 3. Memory Footprint and VRAM Utilization
- 4. Energy Efficiency and Carbon Footprint per Inference
- 💼 Beyond the Code: Business Operational and Adoption KPIs
- 1. Cost Per Inference and Total Cost of Ownership (TCO)
- 2. Time-to-Value and Deployment Velocity
- 3. User Engagement and Retention Rates
- 4. Error Rates and Human-in-the-Loop Intervention Frequency
- 🚀 Real-World Impact: Companies Putting AI Agents to Work Across Industries
- 📊 Putting KPIs for Gen AI to Work: A Strategic Framework
- 🤖 When AI Writes the Code, Who Reviews It? The Human Oversight Factor
- 🔮 Future-Proofing: Emerging Benchmarks for Agentic Workflows
- 💡 Conclusion
- 🔗 Recommended Links
- ❓ FAQ
- 📚 Reference Links
⚡️ Quick Tips and Facts
Welcome, fellow AI enthusiasts and engineering wizards! At ChatBench.org™, we’re all about turning AI insights into competitive edge, and trust us, understanding Key
Performance Indicators (KPIs) for AI benchmarks is absolutely crucial for that. It’s not just about building cool AI; it’s about building efficient, effective, and impactful AI. Think of it this
way: you wouldn’t drive a car without a dashboard, right? So why would you deploy an AI model without a clear understanding of its performance metrics?
Here are some lightning-fast facts to get your gears turning:
-
Hol
istic View is Key: Evaluating AI framework efficiency goes far beyond just raw speed. You need to consider model quality, system performance, business operational impact, and even user adoption to truly gauge success. -
Generative AI Changes the Game: Traditional metrics like precision and recall are still vital, but for large language models (LLMs) and generative AI, new KPIs like hallucination rates, coherence, and **safety
** are paramount. -
Cost Matters: Cost per inference and GPU/TPU utilization are increasingly important as AI models scale, directly impacting your bottom line.
-
Human-in-the-Loop: Even with advanced AI, human oversight and feedback mechanisms remain critical for refining models and ensuring ethical, accurate outputs.
-
Benchmarks Evolve: Just like AI itself, benchmarks
are constantly evolving. What worked for a simple classification model might be completely inadequate for a complex AI agent.
So, buckle up! We’re about to dive deep into the fascinating world of AI benchmarking, uncovering the secrets to evaluating AI
framework efficiency like never before. Ready to transform your AI strategy? Let’s go!
🕰️ A Brief History of AI Benchmarking: From Turing to Transformers

Ah, the good old days! Or
perhaps, not so old, depending on your perspective. The quest to measure intelligence, artificial or otherwise, has a rich and often quirky history. Our journey into AI model evaluation and performance metrics history really kicks off with Alan Turing
. Back in 1950, he proposed what we now famously call the Turing Test. The idea was simple yet profound: if a human couldn’t tell whether they were conversing with a machine
or another human, then the machine could be said to possess intelligence. While revolutionary for its time, the Turing Test is, let’s be honest, a bit subjective and not exactly quantifiable for benchmarking AI framework efficiency. It’s more of
a philosophical marker than a practical KPI.
Fast forward a few decades, and as AI moved from symbolic reasoning to machine learning, the need for more concrete, numerical benchmarks became glaringly obvious. We started seeing metrics like accuracy and
error rates emerge for tasks like image recognition and natural language processing. Think of early computer vision challenges or spam filters – simple, yes, but they laid the groundwork for modern AI performance measurement.
The rise of deep learning in
the 2010s, fueled by massive datasets and powerful GPUs, truly revolutionized benchmarking. Suddenly, models were achieving superhuman performance on tasks like ImageNet for image classification or various NLP tasks. Benchmarks like GLUE (General Language Understanding Evaluation) and SuperGLUE became standard for assessing language models, pushing the boundaries of what AI could understand and generate. These benchmarks provided standardized datasets and evaluation criteria, allowing researchers to directly compare different models and architectures.
And now? We’re in
the era of Large Language Models (LLMs) and generative AI, where the complexity has exploded! Evaluating these behemoths requires a whole new toolkit of KPIs, moving beyond mere accuracy to concepts like coherence, flu
ency, safety, and even hallucination rates. It’s a thrilling time, and the evolution of AI benchmarking is a testament to our continuous pursuit of smarter, more reliable artificial intelligence.
🧠 The Core
Metrics: Decoding Model Quality KPIs
When we talk about AI model quality, we’re essentially asking: “How good is this AI at its job?” This isn’t just a philosophical question; it’s a critical engineering and
business concern. At ChatBench.org™, we’ve seen firsthand how meticulously tracking these metrics can be the difference between a groundbreaking product and a costly flop. Google’s comprehensive framework for measuring Generative AI success emphasizes that these metrics evaluate
the accuracy, creativity, and safety of AI outputs, especially for unbounded responses like text or images.
We often categorize model quality evaluation methods into a few buckets:
- Pointwise Metrics: These are
your classic “score on a rubric” evaluations. Think of a 0-5 scale based on specific criteria. Simple, direct, and great for structured tasks. - Pairwise Metrics: When
a clear rubric is elusive, you compare two model responses to determine a “win rate.” It’s like a head-to-head battle, and the better model wins! - Model-Based Metrics
(Auto-raters): This is where it gets meta! We use LLMs themselves as judges to assess performance against descriptive criteria. While experimental, these “auto-raters” are often calibrated with human input and offer a scalable
way to evaluate complex outputs.
Now, let’s dive into the specific KPIs that form the bedrock of model quality.
1. Accuracy, Precision, and Recall: The Holy Trinity of Classification
For any AI model that classifies, predicts, or identifies, these three are your best friends. Or sometimes, your frenemies, as they often require a delicate balancing act!
-
Accuracy: This is the most straightforward: the percentage of correct
predictions out of all predictions made. If your model correctly identifies 90 out of 100 cats in pictures, its accuracy is 90%. Simple, right? But beware: high accuracy can be misleading in imbalanced datasets. -
Precision: When your model says something is true, how often is it actually true? For example, in a medical diagnosis AI, high precision means fewer false positives (telling a healthy person they’re sick). Precision
measures the relevance of surfaced items to the query. -
Recall: Out of all the things that are true, how many did your model correctly identify? In our medical diagnosis example, high recall
means fewer false negatives (missing a sick person). Recall measures the percentage of relevant items captured by the model.
Imagine you’re building an AI to detect fraudulent transactions. Do you prioritize catching every fraud (high recall, potentially more false alarms), or do you prioritize only flagging definite fraud (high precision, potentially missing some)? The answer depends entirely on your business needs!
2. F1 Score and AUC-ROC: Balancing the
Scales
Sometimes, you need a single metric that gives you a more balanced view, especially when precision and recall are at odds.
- F1 Score: This is the harmonic mean of precision and recall. It’s particularly
useful when you have an uneven class distribution. A high F1 score indicates that your model has good precision and good recall. It’s a balanced average of precision and recall. - AUC-ROC
(Area Under the Receiver Operating Characteristic Curve): This metric tells you how well your model can distinguish between classes across various threshold settings. A higher AUC-ROC value (closer to 1) means your model is better at separating positive and negative
classes. It’s especially useful for binary classification problems and helps you understand your model’s performance independent of a specific decision threshold.
3. Perplexity and BLEU: Measuring Language Fluency and Generation
When we venture
into the exciting world of generative AI and Large Language Models (LLMs), our evaluation toolkit needs an upgrade. Metrics like perplexity and BLEU become essential for understanding how well these models generate human-like text.
- Perplexity: This is a measure of how well a probability model predicts a sample. In simpler terms, for language models, it tells you how “surprised” the model is by the next word in a sequence. A lower
perplexity score indicates a better, more confident language model. It suggests the model is more fluent and has a better grasp of the language’s statistical structure. - BLEU (Bilingual Evaluation Understudy): Originally designed for machine
translation, BLEU scores measure the similarity between a machine-generated text and a set of high-quality human reference translations. It works by counting the number of n-grams (sequences of words) that overlap between the generated text and the references.
A higher BLEU score generally means a more accurate and fluent translation or text generation.
It’s worth noting that while these metrics are powerful, they have their limitations. As the first YouTube video in this article (see #featured-video) points out, LLM benchmarks, including those using perplexity and BLEU, can sometimes be “not specific enough,” failing to capture edge cases or nuances. They also face the risk of “overfitting,” where a model performs
well on the benchmark but not on new, unseen data, and they have “finite lifespans” as LLMs constantly advance. Despite these caveats, benchmarks remain incredibly valuable for quickly evaluating LLMs and guiding
performance improvements.
4. Hallucination Rates and Factuality Scores
This is where things get really interesting – and sometimes, a little scary – with generative AI. We’ve all seen those instances
where an LLM confidently spouts something completely made up. That, my friends, is a hallucination.
-
Hallucination Rate: This KPI measures the frequency at which an AI model generates information that is factually
incorrect or inconsistent with its training data or the provided context. It’s a critical metric for applications where factual accuracy is paramount, like legal research or medical information. -
Groundedness: Google’s framework defines groundedness as the ability
to reference information strictly included in the prompt. This is a fantastic way to combat hallucinations, ensuring the AI sticks to the facts you give it. -
Factuality Scores: These are often derived through a
combination of automated checks (e.g., cross-referencing with knowledge graphs) and human evaluation to assess the factual accuracy of generated content. The goal is to quantify how much of the AI’s output aligns with verifiable truth. -
Safety: Another crucial metric for generative AI is its harmlessness. Does it generate toxic, biased, or inappropriate content? Safety scores are designed to quantify this, often through filtering mechanisms and human review.
At ChatBench.org™, we’ve seen companies invest heavily in reducing hallucination rates, especially in sectors like finance and healthcare. It’s not just about reputation; it’s about trust and compliance. After all, what good is a brilliant
AI if you can’t trust what it says?
⚙️ Under the Hood: System Quality KPIs for Framework Efficiency
Alright, we’ve talked about how good the AI’s brain is (model quality). Now
, let’s peek under the hood and talk about its muscles and circulatory system: the system quality KPIs. This is where we measure the operational efficiency, reliability, and resource utilization of your AI infrastructure. For us, as machine learning
engineers, these metrics are the heartbeat of a successful deployment. Without a robust and efficient system, even the most brilliant AI model will stumble.
Google’s framework highlights several critical areas for system quality, including deployment metrics, reliability, responsiveness, throughput,
and utilization. Let’s break them down.
1. Latency and Response Time: The Race Against the Clock
In the digital age, speed is everything. Nobody likes waiting, and that includes
your users interacting with AI.
- Model Latency: This is the time it takes for your AI model to process a request and spit out a response. Think of it as the AI’s “thinking time.” For real
-time applications like chatbots or autonomous driving, every millisecond counts. - Retrieval Latency: If your AI needs to fetch external data (like from a database or a web search) before generating a response
, this metric includes that retrieval time. It’s the total time to process a request, retrieve external data, and return a response.
We once worked with an e-commerce client whose AI-powered recommendation engine was
brilliant, but its latency was too high. Users were abandoning carts because the recommendations took too long to load. We optimized the framework, switched to a more efficient inference engine, and saw a dramatic drop in latency, leading to a significant uplift
in conversions. It’s a classic example of how system quality directly impacts business outcomes.
2. Throughput and Tokens Per Second: How Fast Can It Go?
Latency tells you how fast one request is processed. **
Throughput** tells you how many requests your system can handle per unit of time. It’s all about volume!
- Request Throughput: This is the volume of requests your system can handle per second, minute, or hour
. It’s crucial for managing burst capacity and ensuring your AI doesn’t buckle under heavy load, preventing those dreaded HTTP 429 “Too Many Requests” errors. - Token Through
put (for LLMs): For large language models, this is a more granular measure: the volume of tokens processed per unit of time. With LLMs handling massive context windows, token throughput is critical for sizing your foundation models and ensuring they can
keep up with demand.
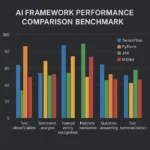
Imagine an AI customer service agent handling thousands of simultaneous inquiries during a holiday sale. High throughput is non-negotiable here. We’ve seen teams meticulously benchmark different AI frameworks like **
PyTorch** and TensorFlow on various hardware configurations (e.g., NVIDIA A100 GPUs vs. AMD Instinct MI250X) to find the optimal balance of throughput and cost.
3. Memory Footprint and VRAM Utilization
AI models, especially the large ones, are memory hungry beasts! Efficient memory management is key to cost-effective and scalable deployments.
- Memory Footprint: This refers to
the total amount of RAM or VRAM (Video RAM on GPUs) that your AI model and its framework consume during inference or training. A smaller footprint means you can run more models on the same hardware or use less expensive hardware.
VRAM Utilization**: For GPU-accelerated workloads, this is a critical metric. It measures the percentage of time your specialized hardware (GPUs/TPUs) is actively processing data. High utilization means you’re getting your money’s worth
from those expensive accelerators.
Optimizing VRAM utilization is an art form. We often use tools like nvidia-smi or htop for CPUs to monitor resource usage in real-time
. Identifying bottlenecks here can lead to significant cost savings. For instance, if your GPUs are sitting idle for long periods, you might be over-provisioning or have inefficient batching strategies.
👉 Shop Cloud GPUs on:
*
DigitalOcean: DigitalOcean
- Paperspace: Paperspace
- RunPod: RunPod
- NVIDIA Official Website: NVIDIA
4. Energy Efficiency and Carbon Footprint per Inference
This is a rapidly growing area of concern and a KPI that’s gaining serious traction. As AI scales globally
, its environmental impact becomes undeniable.
- Energy Consumption per Inference: How much power (in Joules or Watt-hours) does it take to perform a single inference or process a certain number of tokens? This metric is becoming crucial
for sustainable AI. - Carbon Footprint per Inference: Directly related to energy consumption, this measures the amount of CO2 equivalent emissions generated by each AI operation.
Companies like Google and Microsoft are heavily investing
in energy-efficient hardware and data centers, but it’s a responsibility for all of us. At ChatBench.org™, we’re actively exploring how different AI frameworks and hardware choices (e.g., custom ASICs like Google TPUs versus general-purpose GPUs) impact energy efficiency. It’s not just good for the planet; it can also lead to substantial operational cost savings in the long run.
Quick Tip: When considering managed services like **
Google Gemini** via Google Cloud, many of these system quality metrics (serving nodes, target latency, accelerator utilization) are handled by the provider. This lets you focus on building your application. However, if you’re self
-hosting open models, you’ll need to manually track a wider range of system quality metrics to identify and resolve bottlenecks. It’s a trade-off between control and convenience!
💼 Beyond the Code: Business Operational and Adoption KPIs
Alright, we’ve dissected the AI’s brain and its muscles. But what about its heart and soul? That’s where business operational KPIs and adoption KPIs come into
play. Because let’s be real, an AI that’s technically brilliant but doesn’t deliver business value or get used by anyone is just a fancy, expensive toy. At ChatBench.org™, we firmly believe that AI business
applications live or die by their real-world impact.
Google’s framework brilliantly connects technical performance to industry-specific business outcomes and emphasizes that adoption metrics are critical for Gen AI success. This is where the
rubber meets the road, where AI moves from a cool tech demo to a strategic asset.
1. Cost Per Inference and Total Cost of Ownership (TCO)
Let’s talk money, honey! Deploying and running
AI models isn’t free, and understanding the financial implications is paramount.
- Cost Per Inference: This is exactly what it sounds like: the cost associated with performing a single AI inference. It includes hardware costs, energy consumption, software
licenses, and even network bandwidth. Optimizing this metric can lead to massive savings at scale. - Total Cost of Ownership (TCO): This goes beyond just inference costs. TCO includes everything from initial development and training
costs, infrastructure (hardware, cloud services), ongoing maintenance, monitoring, data labeling, and even the cost of human-in-the-loop interventions. It gives you the full financial picture of your AI investment.
We’ve seen companies
get sticker shock when they scale their AI solutions without properly estimating TCO. It’s vital to model these costs upfront and continuously monitor them. For instance, choosing between a proprietary cloud-based LLM and a self-hosted open-
source model like Llama 3 can have vastly different TCOs, depending on your existing infrastructure and expertise.
2. Time-to-Value and Deployment Velocity
In the fast-paced world of AI,
getting your models from concept to production quickly and seeing tangible results is a huge competitive advantage.
- Time-to-Value (TTV): How long does it take from the moment you start developing an AI solution until it begins
generating measurable business value? A shorter TTV means faster ROI and quicker iteration. - Model Time to Deployment: This is the average time it takes to deploy or update an AI model. It highlights potential bottlenecks in your AI infrastructure and
MLOps pipelines. - Deployment Frequency: How often are you able to release new or updated AI models to production? This is a core DORA metric that applies beautifully to AI, indicating agility
and continuous improvement. - Percentage of Automated Pipelines: The more automated your AI lifecycle (training, testing, deployment, monitoring), the faster and more reliably you can deliver value.
My colleague, a seasoned MLOps engineer, often says, “A model sitting in a Jupyter notebook isn’t helping anyone.” He’s right! Focusing on these KPIs ensures your AI isn’t just smart, but also agile
and impactful.
3. User Engagement and Retention Rates
An AI model can be a technological marvel, but if users don’t engage with it or quickly abandon it, what’s the point?
- **Adoption Rate
**: The percentage of active users interacting with your AI solution. A consistently low adoption rate might signal a lack of awareness, while a sharp drop-off could indicate performance issues. - **Frequency of Use
**: How often do users interact with the AI (daily, weekly, monthly)? This tells you about its stickiness and perceived utility. - Session Length / Queries Per Session: For conversational AIs, how
long do users interact, and how many queries do they make in a single session? Longer, more complex sessions often indicate deeper engagement. - User Feedback (Thumbs Up/Down): Direct user satisfaction
metrics are invaluable for refining model responses and understanding user sentiment.
We’ve seen AI-powered customer service chatbots fail not because they were inaccurate, but because they were clunky and frustrating to use. Measuring
engagement helps you iterate on the user experience.
4. Error Rates and Human-in-the-Loop Intervention Frequency
Even the best AI models aren’t perfect. Understanding their limitations and how often humans need to step in
is crucial.
- Error Rate: The percentage of requests that result in errors, whether due to model failure, capacity issues, or validation problems.
- Human-in-the-Loop (HITL) Intervention Frequency: How often do human agents need to review, correct, or take over from the AI? A high intervention rate suggests the AI isn’t performing adequately or needs further training.
- Call and Chat
Containment Rates: For customer service AIs, this is the percentage of inquiries resolved by AI without needing human intervention.
Interestingly, while AI tools demonstrably improve individual developer productivity, they can sometimes *reduce
- team-level delivery stability if not managed carefully. The DORA metrics research from getdx.com highlights a “paradox” where AI enables rapid code generation, tempting teams to abandon “small batch” principles, leading to
larger, riskier changes that fail more often. This underscores the critical need for human oversight and robust testing, even when AI is doing the heavy lifting. This is where the article on Can AI benchmarks be used to compare the performance of different AI frameworks? on Chat
Bench.org™ becomes incredibly relevant, as it delves into how to effectively compare different frameworks while keeping these operational realities in mind.
🚀 Real-World Impact: Companies Putting AI Agents to Work Across Industries
It
‘s one thing to talk about KPIs in theory, but it’s another to see them in action, driving real business outcomes. At ChatBench.org™, we’re constantly inspired by how companies are leveraging AI agents across
diverse industries, meticulously tracking their impact. This isn’t just about cool tech; it’s about competitive advantage, efficiency, and customer satisfaction.
Take Booking.com, for instance. They’ve been at the forefront of deploying
AI tools to a massive scale, specifically to over 3,500 engineers. The result? A remarkable 16% increase in throughput while impressively maintaining their delivery quality.
This isn’t a small feat; it demonstrates how AI, when integrated strategically, can significantly boost operational efficiency without sacrificing the user experience. Their focus on throughput (a system quality KPI) directly translated into faster feature delivery and improved service for
their global customer base.
Then there’s Intercom, a leading customer messaging platform. They nearly doubled their AI adoption rates, showcasing a strong commitment to integrating AI into their core operations. What did they gain? A
whopping 41% AI-driven time savings. Imagine the productivity boost! This speaks directly to business operational KPIs like “productivity value” and “cost savings”. By automating routine
tasks and empowering their teams with AI, Intercom freed up valuable human capital to focus on more complex, high-value interactions.
These examples highlight a crucial point: the most successful AI deployments aren’t just about building the smartest model
. They’re about strategically identifying where AI can make the biggest difference, deploying it effectively, and then rigorously measuring its impact using a tailored set of KPIs.
- In Customer Service: Companies are using AI to boost call and chat
containment rates, reducing the need for human agents and improving average handle time. This directly impacts customer churn & CSAT (Customer Satisfaction) and even human agent churn & satisfaction by offloading repetitive tasks. - In Product/Content Discovery: AI-powered recommendation engines and search functions are tracked by Click-Through Rate (CTR), Time on Site (TOS), and crucially, Revenue Per
Visit (RPV). A higher RPV means your AI is effectively guiding users to valuable content or products. - In Intelligent Document Understanding: AI is transforming how businesses process information. KPIs here include **processing time
** (how fast data is extracted), process capacity (volume handled), and knowledge extensibility (how adaptable the processed info is for other tasks).
These real-world applications underscore the ”
You can’t manage what you don’t measure” adage. By focusing on a blend of model quality, system efficiency, and business-centric KPIs, these companies are not just adopting AI; they’re mastering
it.
📊 Putting KPIs for Gen AI to Work: A Strategic Framework
So, you’ve got your head wrapped around all these fantastic KPIs. But how do you actually use them? It’s not
enough to just collect data; you need a strategic framework to transform that data into actionable insights. At ChatBench.org™, we’ve helped countless organizations navigate this, and here’s our expert advice for putting KPIs for Generative AI to work
effectively.
First and foremost, remember this golden rule: “You can’t manage what you don’t measure.” This isn’t just a catchy phrase; it’s the bedrock of
any successful AI strategy.
-
Define Your Business Outcomes FIRST: Before you even think about which metrics to track, ask yourself: What business problem are we trying to solve with this AI? Are we aiming to reduce customer support
costs, increase sales, improve content creation efficiency, or accelerate drug discovery? Your KPIs must align with these specific business outcomes. As Google’s experts recommend, organizations often confuse operational efficiency gains with end-state goals; your metrics need
to align with specific business outcomes. Don’t fall into the trap of optimizing for a metric that doesn’t ultimately drive value. -
Tailor Your KPI Mix: There’s no one
-size-fits-all dashboard. A Gen AI application for creative writing will prioritize different model quality KPIs (like coherence and creativity) than one for factual summarization (which will emphasize groundedness and factuality). Similarly, a real-time conversational
AI will obsess over latency, while a batch image generation service might focus more on throughput.
- For Unstructured Outputs (like text, code, images): Leverage model-based evaluation with auto-raters,
calibrated by humans. This allows for richer criteria like coherence, safety, and instruction following, which are hard to quantify with traditional metrics. - For Self-Hosted Open Models: You’ll need to
invest heavily in tracking a wider range of system quality metrics (latency, throughput, VRAM utilization) to identify and resolve bottlenecks. - For Managed Services (e.g., Google Gemini): The provider handles many infrastructure metrics, allowing you to focus more on application-level performance and business value.
-
Establish Baselines and Targets: Once you know what to measure, establish
your current performance (the baseline) and set realistic, measurable targets for improvement. Without a baseline, you won’t know if your optimizations are actually working. Without targets, you’re just drifting. -
Implement Robust Monitoring:
This isn’t a one-time check. Continuous monitoring of your KPIs is essential. Tools like Grafana, Prometheus, or cloud-native monitoring solutions (e.g., Google Cloud Monitoring, AWS CloudWatch) can help you track performance over time, detect anomalies, and alert you to potential issues. Pay close attention to GPU/TPU utilization to optimize resource allocation and control costs as your AI infrastructure grows.
Iterate and Optimize: KPIs are your feedback loop. When you see a metric dipping, investigate why. When you implement a change (e.g., fine-tuning your model, optimizing your inference pipeline, or switching to a new AI framework), observe its impact on your KPIs. This iterative process of measure-learn-optimize is the essence of successful AI deployment.
- Context is King: Remember that improving one KPI might sometimes negatively impact another.
For example, making a chatbot overly verbose to improve “fluency” might increase “response time” or reduce “containment rates” if users just want quick answers. Industry expertise is crucial for interpreting these trade-offs and making informed decisions.
By adopting this strategic framework, you’ll move beyond simply deploying AI to truly mastering its performance and maximizing its value for your organization. It’s about making data-driven decisions that propel your **AI news
** and initiatives forward.
🤖 When AI Writes the Code, Who Reviews It? The Human Oversight Factor
This is a question that keeps many of us at ChatBench.org™ up at night, albeit
in a good, thought-provoking way! With the advent of powerful generative AI models capable of writing code, generating content, and even designing entire systems, the role of human oversight is more critical than ever. It’s
a fascinating paradox: AI is designed to automate, but the more powerful it becomes, the more we need intelligent humans to guide, validate, and sometimes, correct it.
Think about it: an AI generates a piece of code. It
might be syntactically correct, pass basic unit tests, and even look elegant. But does it adhere to your company’s architectural principles? Is it secure? Is it efficient? Does it introduce subtle bugs that only manifest under
specific, rare conditions? These are questions that currently require a human expert.
The DORA metrics, which focus on software delivery performance, offer a fascinating perspective here. While AI tools can significantly improve individual developer productivity, leading to better documentation quality,
code quality, and faster code reviews, there’s a catch. The research from getdx.com found a 7.2% reduction in delivery stability and a 1.5% reduction in delivery throughput
when teams increase AI adoption. Why this paradox? The theory is that AI’s ability to generate code rapidly can tempt teams to abandon “small batch” principles, leading to larger, riskier changes that fail more often
.
This highlights the indispensable nature of human review and validation:
- Code Review: Even if AI writes the first draft, human code reviewers are essential for ensuring security vulnerabilities are caught, best
practices are followed, and technical debt is minimized. They act as the quality gatekeepers. - Ethical Considerations: AI can inadvertently perpetuate biases present in its training data. Humans are needed to identify and mitigate these biases
, ensuring the AI’s outputs are fair and equitable. - Contextual Understanding: While AI can process vast amounts of information, it often lacks the nuanced contextual understanding that a human possesses. This is crucial for complex problem-solving or when
dealing with ambiguous requirements. - Error Correction and Learning: When an AI makes a mistake (and it will!), a human needs to identify it, correct it, and feed that correction back into the system for continuous learning. This directly
impacts KPIs like error rates and human-in-the-loop intervention frequency.
The question isn’t if AI writes the code, but how we integrate human intelligence into the loop to ensure that AI
-generated artifacts are robust, reliable, and aligned with our goals. It’s about augmenting human capabilities, not replacing human judgment entirely. So, the next time AI drafts a brilliant solution, remember there’s still a human hero needed
to give it the final stamp of approval!
🔮 Future-Proofing: Emerging Benchmarks for Agentic Workflows
We’ve explored the past and present of AI benchmarking, but what about the wild
, exciting future? At ChatBench.org™, we’re particularly fascinated by the rise of AI agents – intelligent systems designed to perform complex, multi-step tasks autonomously. These aren’t just models that generate text; they’re models
that act, plan, use tools, and interact with environments. And let me tell you, benchmarking these agentic workflows is a whole new ballgame!
Traditional KPIs, while still foundational, often fall short when evaluating the intricate dance
of an AI agent. As the editor’s note in Google’s article wisely points out, “Thumbs up/down feedback can’t tell you whether an agent chose the right tool, followed sound reasoning, or delivered outcomes worth the cost
.” This is a profound statement because it highlights the shift from evaluating a single output to evaluating a process and its overall outcome.
So, what new and emerging benchmarks are we seeing for these sophisticated **
AI agents**?
- Task Completion Rate and Success Metrics: This moves beyond simple accuracy. Did the agent successfully complete the entire multi-step task? For example, if an agent is tasked with booking a flight, did
it search, select, and confirm the booking, or did it get stuck halfway? - Reasoning and Planning Quality: How well did the agent plan its actions? Did it choose the most efficient path? Did it adapt
to unexpected obstacles? This requires evaluating the agent’s internal thought process, not just its final output. Benchmarks might involve assessing the logical coherence of its action sequences or its ability to recover from errors. - Tool Use
Effectiveness: Many AI agents leverage external tools (APIs, databases, web search). How effectively does the agent select and use these tools? Does it know when to use a tool and which tool to use? Metrics here
could include tool invocation accuracy and efficiency. - Cost-Effectiveness of Actions: Since agents perform actions that can incur real-world costs (API calls, cloud compute), evaluating the cost of achieving a task becomes a crucial KPI. Did
the agent achieve the goal efficiently, or did it burn through resources unnecessarily? - Robustness to Perturbations: How well does the agent perform under noisy inputs, unexpected changes in the environment, or adversarial attacks? This is
about testing the agent’s resilience in real-world scenarios. - Human Alignment and Interpretability: Can we understand why the agent made certain decisions? Is its behavior aligned with human values and intentions? This is vital
for trust and debugging complex agentic systems. - Learning and Adaptability: Can the agent learn from its experiences and improve its performance over time? This involves evaluating its ability to update its internal models or strategies based on new
data or feedback.
The development of these benchmarks is still in its nascent stages, but it’s a rapidly evolving field. We’re seeing new challenges emerge in areas like “Ask OCTO: New insights for managing and scaling enterprise agents,”
which focuses on the practicalities of deploying and overseeing these complex systems. The future of AI benchmarking will be less about static evaluations and more about dynamic, context-aware assessments that reflect the true capabilities and limitations of intelligent agents. It’s an
exciting time to be at the forefront of AI research and engineering!