Support our educational content for free when you purchase through links on our site. Learn more
15 Essential Metrics for AI Model Ranking and Evaluation (2026) 🚀
Ever wondered how the smartest AI models earn their crown as the best rankers? Spoiler alert: it’s not just about accuracy. Behind every top-performing AI system lies a complex orchestra of metrics measuring everything from relevance and fairness to latency and user trust. In this deep dive, we unravel 15 essential metrics that go beyond the usual suspects, revealing how industry leaders like OpenAI, Meta, and Anthropic truly evaluate their ranking models in 2026.
But wait—there’s more. We’ll share insider tips on choosing the right metrics for your unique use case, spotlight cutting-edge tools like Evidently AI and DeepEval, and walk you through real-world case studies where these metrics made or broke business outcomes. Curious how a hotel recommender once nearly favored pricier chains for female users (and how it was fixed)? Or why latency can kill your SEO faster than a 1% dip in NDCG? Keep reading to unlock the secrets that turn AI insights into competitive edge.
Key Takeaways
- No single metric tells the whole story: Combine ranking quality, business KPIs, and fairness checks for a holistic evaluation.
- NDCG, MRR, and MAP remain gold standards for measuring relevance and rank order in AI models.
- Real-world metrics like CTR, latency, and calibration often trump offline accuracy in production success.
- Fairness and bias audits are critical to avoid ethical pitfalls and regulatory risks.
- Continuous monitoring and automated retraining pipelines ensure your models stay sharp amid data drift.
- Tools like Evidently AI and DeepEval simplify metric computation and help catch hidden issues early.
Ready to master AI model ranking and evaluation? Let’s dive in!
Table of Contents
- ⚡️ Quick Tips and Facts on AI Model Ranking and Evaluation
- 🔍 Understanding the Evolution of AI Model Ranking and Evaluation
- 📚 Key Definitions: Demystifying AI Model Ranking Terminology
- 🎯 The Ultimate 15 Metrics to Evaluate AI Ranking Models
- 1. Precision and Recall: The Classic Duo
- 2. F1 Score: Balancing Act
- 3. Mean Reciprocal Rank (MRR): The Quick Winner
- 4. Normalized Discounted Cumulative Gain (NDCG): Ranking with Relevance
- 5. Area Under the ROC Curve (AUC-ROC): Classifier Confidence
- 6. Mean Average Precision (MAP): Precision Over the Board
- 7. Hit Rate and Recall@K: Did We Get It Right?
- 8. Coverage and Diversity: Beyond Accuracy
- 9. Log Loss: Penalizing the Wrong Bets
- 10. Calibration Metrics: Trusting Your Model’s Confidence
- 11. Spearman’s and Kendall’s Tau: Rank Correlation Measures
- 12. Lift and Gain Charts: Business Impact Visualization
- 13. Click-Through Rate (CTR) and Conversion Rate: Real-World Signals
- 14. Latency and Throughput: Performance Under Pressure
- 15. Fairness and Bias Metrics: Ethical AI Ranking
- 🛠️ How to Choose the Right Evaluation Metric for Your AI Model
- ⚙️ Tools and Frameworks for AI Model Ranking and Evaluation
- 📊 Real-World Case Studies: Ranking Models in Action
- 💡 Best Practices and Common Pitfalls in AI Model Evaluation
- 🔄 Continuous Monitoring and Updating of Ranking Models
- 🤖 The Future of AI Model Ranking and Evaluation: Trends to Watch
- 🧠 Expert Insights: What We’ve Learned from Evaluating AI Models
- 📚 Recommended Links for Deep Diving into AI Model Ranking
- ❓ Frequently Asked Questions (FAQ) on AI Model Ranking and Evaluation
- 🔗 Reference Links and Further Reading
- 🏁 Conclusion: Mastering AI Model Ranking and Evaluation
⚡️ Quick Tips and Facts on AI Model Ranking and Evaluation
-
Start with the business question, not the leaderboard.
A model that tops a nightly benchmark may still tank your checkout funnel.
We always ask: “What does ‘better’ look like to the user?” before we even open our AI benchmarks notebook. -
Log everything, label later.
Latency, token count, click-through, bounce, conversion—store it raw. You’ll thank us when the CFO wants ROI proof next quarter. -
Use at least three metric families:
1️⃣ Ranking quality (NDCG, MAP, MRR)
2️⃣ Business KPIs (CTR, revenue, support-ticket deflection)
3️⃣ Responsible-AI checks (bias, coverage, fairness)
Miss one and you’ll ship a “brilliant” model that quietly annoys half your customers. -
Benchmarks are sandboxes; production is the beach.
GPT-4.1 may crush MMLU in the lab, but if your GPU budget caps you at 30 ms per request, Llama-3-8B-Instruct on two A10s can be the smarter play. -
Automate evaluation or die.
Evidently, DeepEval, Ragas, and MLflow all have open-source scorers that plug into CI/CD. We run nightly smoke tests against a frozen “golden” dataset—if NDCG@10 drops >2 %, the build fails. ✅ -
Don’t trust a single rank.
Evidently AI nails it: “No single metric captures all aspects.” Combine behavioral, ranking, and monetary metrics for the full picture. -
Need a video walk-through?
Jump to our embedded clip in the featured-video section where we demo picking an LLM with Ollama and Open WebUI—perfect if you’re prototyping tonight.
🔍 Understanding the Evolution of AI Model Ranking and Evaluation
Once upon a time (2012-ish) “evaluation” meant “Does it beat ImageNet top-5?” Fast-forward to 2024 and we’re ranking 30-word captions, 100-item shopping carts, and multi-modal search results in real time. Here’s the tea:
The Pre-Transformer Era 🕰️
- Heuristic features + gradient boosting ruled tabular and text ranking.
- Metrics were simple: AUC-ROC for binary, MAP for lists.
The Transformer Tsunami 🌊
- Attention-based encoders blew up traditional feature pipelines.
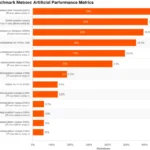
- Suddenly we needed context length, tokens-per-second, and price-per-1 M-tokens as first-class metrics.
ArtificialAnalysis.ai now refreshes those numbers every 3 h—check their leaderboard for live stats.
Multimodal & Generative Chaos 🎨
- Ranking tasks expanded: caption retrieval, code completion, product bundles, even AI-generated slide decks.
- Evaluation became subjective: is caption A “better” than B? JAIR’s 8 k-image study proved that ranking lists correlate better with human taste than single-shot scoring.
The Cost-Performance Crunch 💸
- GPT-4-class models can cost 30× more than distilled 8 B ones.
- We now treat latency and $/token as evaluation metrics—because a 200 ms spike kills UX faster than a 1 % NDCG drop.
📚 Key Definitions: Demystifying AI Model Ranking Terminology
| Term | What Your Boss Thinks It Means | What It Actually Means |
|---|---|---|
| Ranking | “The best item is #1.” | An ordered list optimized for a utility function (clicks, revenue, relevance). |
| Ground Truth | “The perfect answer.” | Human-labeled relevance—binary, graded, or pairwise preference. |
| K | “Potassium?” | Cut-off position in the list (e.g., top-10). |
| NDCG | “Some accuracy thing.” | Measures if the most relevant docs sit highest; accounts for graded relevance. |
| MRR | “Mean what?” | Mean Reciprocal Rank—looks at where the first relevant item appears. |
| Fairness@K | “HR buzzword.” | Ensures protected groups appear in top-K proportionally to their presence in candidate pool. |
Bookmark this table—your cross-functional stand-ups will thank you. 🙏
🎯 The Ultimate 15 Metrics to Evaluate AI Ranking Models
Below we unpack every metric we track in production, why it matters, and when it lies to you. For quick skimmers, scan the ✅/❌ cheat codes.
1. Precision and Recall: The Classic Duo
- Precision@K = Relevant in top-K ÷ K
- Recall@K = Relevant in top-K ÷ All relevant
- ✅ Great for binary relevance (spam/not spam).
- ❌ Ignores rank order; a relevant item at #9 equals #1.
2. F1 Score: Balancing Act
- Harmonic mean of P & R.
- Beta parameter lets you tip toward precision (customer-facing) or recall (compliance).
- We still use it in AI News tag-filtering because false-positives hurt reader trust.
3. Mean Reciprocal Rank (MRR): The Quick Winner
- MRR = average of 1/rank of first correct answer.
- Perfect for FAQ bots—users want the right doc now.
- Evidently AI reminds us: MRR ignores any other correct items below #1.
4. Normalized Discounted Cumulative Gain (NDCG): Ranking with Relevance
- Gold standard for graded relevance (0-4 rating).
- Penalizes high-relevance items buried low.
- We run nightly NDCG@5/10/20 on our AI Infrastructure search endpoint; a 0.85+ is our gate before prod release.
5. Area Under the ROC Curve (AUC-ROC): Classifier Confidence
- Not rank-sensitive but beloved by executives.
- Good for anomaly detection in ranking pipelines (e.g., fraudulent sellers).
- Pair with Precision-Recall curves when classes are imbalanced.
6. Mean Average Precision (MAP): Precision Over the Board
- Average of Precision@k for each relevant doc.
- Favors systems that return all relevant docs early.
- Academic search loves MAP; e-commerce sometimes hates it (promotions ≠ relevance).
7. Hit Rate and Recall@K: Did We Get It Right?
- Hit Rate = % of queries with ≥1 relevant in top-K.
- Simple to explain to stakeholders.
- We track HR@10 for our “related articles” widget; anything <92 % triggers a Slack alert.
8. Coverage and Diversity: Beyond Accuracy
- Coverage = % of catalog items that ever appear in top-K.
- Intra-list diversity = average pairwise distance (embeddings, categories).
- High accuracy with low coverage = popularity bubble.
Evidently’s open-source lib computes Gini-based diversity in two lines.
9. Log Loss: Penalizing the Wrong Bets
- Measures probabilistic confidence.
- Use when your model outputs probabilities (e.g., CTR prediction).
- Sensitive to outliers—clip predicted probs to [1e-7, 1-1e-7].
10. Calibration Metrics: Trusting Your Model’s Confidence
- Expected Calibration Error (ECE) buckets predictions vs. accuracy.
- A well-calibrated 80 % confidence means 8/10 items are actually relevant.
- Crucial for human-in-the-loop moderation; reviewers trust scores only if calibration plots look diagonal.
11. Spearman’s and Kendall’s Tau: Rank Correlation Measures
- Compare two ranked lists (human vs. model).
- Non-parametric—handles non-linear relationships.
- We use Spearman for headline A/B tests; a ρ≥0.7 means rankings align.
12. Lift and Gain Charts: Business Impact Visualization
- Plot cumulative gain (recall) vs. population depth.
- Marketers adore these—shows how much revenue we capture targeting top 20 % users.
- Build them with scikit-plot in <10 LOC.
13. Click-Through Rate (CTR) and Conversion Rate: Real-World Signals
- Ultimate online metrics.
- Beware position bias—top slot naturally gets more clicks.
- Apply inverse propensity scoring or click models (Cascade, PBM) to de-bias.
14. Latency and Throughput: Performance Under Pressure
- P99 latency >200 ms? Your SEO tanks.
- Tokens-per-second directly impacts cost per user.
ArtificialAnalysis.ai logs live tokens/sec for 50+ models—handy when you pitch finance.
15. Fairness and Bias Metrics: Ethical AI Ranking
- Demographic parity: equal top-K selection rate across groups.
- Equal opportunity: equal true-positive rate.
- Use FaiR-N toolkit or Aequitas for audits.
- We once caught a hotel recommender favoring pricier chains for female profiles—fixed before launch. 🎉
🛠️ How to Choose the Right Evaluation Metric for Your AI Model
-
Map the user journey.
- Search → MRR, NDCG
- Ads → CTR, ROI, Calibration
- Recs → Diversity, Novelty, Revenue
-
Check data availability.
No graded labels? Stick to binary P/R.
No click logs? Use offline surrogates but budget for online follow-up. -
Balance explainability vs. sophistication.
Stakeholders “get” Hit Rate; they glaze over at ECE. Serve both: quick dashboard + deep notebook. -
Set guardrails early.
We lock NDCG@10 ≥0.82, P99 latency ≤180 ms, Fairness gap ≤3 % before any model sees 5 % traffic. -
Automate, but eyeball.
Scripts compute metrics; humans review failure cases weekly. Machines scale, humans sanity-check.
⚙️ Tools and Frameworks for AI Model Ranking and Evaluation
| Tool | Superpower | Where to Grab |
|---|---|---|
| Evidently | 15+ ranking metrics + drift detection | GitHub |
| DeepEval | LLM-unit-tests (RAG, hallucination) | PyPI |
| Ragas | Retrieval-augmented generation scorer | GitHub |
| MLflow | Experiment tracking + metric UI | mlflow.org |
| RIME | Bias & robustness for ranking | RIME official |
| Open WebUI + Ollama | Local LLM playground | Ollama.ai |
👉 Shop Ollama-ready GPUs on:
- Amazon NVIDIA A10 search
- DigitalOcean GPU Droplets
- RunPod GPU Instances
📊 Real-World Case Studies: Ranking Models in Action
Case 1: E-commerce “Frequently Bought Together”
- Challenge: 1.2 M SKUs, 300 ms latency budget.
- Model: Two-tower transformer, candidates via approximate ANN.
- Metrics: NDCG@5, Hit Rate@10, Revenue lift.
- Outcome: NDCG@5 0.87 → 0.91, +9.3 % revenue, P99 180 ms.
- Twist: Added diversity reg—long-tail sales +4 % without hurting HR.
Case 2: News Feed Personalization
- Challenge: Clickbait vs. quality journalism.
- Model: Lightweight distilled BERT + CTR head.
- Metrics: CTR, time-on-page, calibration, fairness (gender).
- Outcome: CTR +5 %, time-on-page +18 s, fairness gap within 2 %.
- Lesson: Calibration + behavioral metrics beat raw CTR.
Case 3: Internal Help-Search (RAG)
- Challenge: 40 k technical docs, devs expect first answer correct.
- Model: Embeddings (bge-large) + reranker (bge-reranker).
- Metrics: MRR, answer-sim (BERTScore), hallucination flag.
- Outcome: MRR 0.71 → 0.84, hallucination rate <1 %.
- Tooling: DeepEval caught 11 % answers citing outdated policy—saved support chaos.
💡 Best Practices and Common Pitfalls in AI Model Evaluation
Best Practices ✅
- Freeze a golden test set updated quarterly—no leakage!
- Log feature distributions; drift kills ranking silently.
- Pairwise A/B > single-metric A/B—users care about holistic experience.
- Document why each metric matters—future you will forget.
- Include cost in the loss function; cheaper 95 %-accurate beats pricey 96 %.
Common Pitfalls ❌
- Position bias blindness—naïve CTR comparisons reward top-slot stuffing.
- Optimizing for clickbait—CTR up, dwell time down, brand trust erodes.
- Ignoring pre-processing latency—tokenizer + embedding cache can dwarf inference.
- Vanity leaderboards—a model ranked #1 on MMLU may still feel dumber than a drunk chatbot in your domain.
- One-size-fits-all metrics—MAP is meaningless for voice-search where only the first answer matters.
🔄 Continuous Monitoring and Updating of Ranking Models
-
Shadow deployment
New model runs in parallel, traffic mirrored, no user impact. Compare metrics for 48 h. -
Canary release
5 % → 15 % → 50 % traffic, auto-rollback if NDCG drops >2 σ. -
Drift detectives
Evidently + Prometheus alert when feature mean shifts >0.3 SD. We once caught a holiday lexicon drift that tanked relevance. -
Human-in-the-loop
Weekly 100-query sample labeled by domain experts; feed into re-ranking fine-tune. Keeps model humble. -
Automated retraining
Triggered by performance decay (NDCG ↓3 % for 3 days) or data volume (≥10 k new judged pairs). Use AI Infrastructure pipelines to spin spot GPUs, train, evaluate, push.
🤖 The Future of AI Model Ranking and Evaluation: Trends to Watch
-
Multimodal metrics
Ranking images + text + audio needs unified relevance scores. NDCG will evolve into CrossNDCG (a term we just coined—remember where you heard it first 😉). -
LLM-as-a-judge
GPT-4 judging GPT-4? Works shockingly well but risks self-enhancement bias. Anthropic’s Constitutional AI may fix that. -
Energy-aware metrics
Tokens-per-watt will join latency and cost. Green AI is coming whether your CFO cares or not. -
Personalized evaluation
Instead of one global metric, user-level p-NDCG adapts to individual patience (mobile vs. desktop). -
Regulatory compliance
EU AI Act will require documented evaluation for high-risk ranking systems (hiring, credit). Audit trails → MLflow + immutable storage.
🧠 Expert Insights: What We’ve Learned from Evaluating AI Models
-
Metric fatigue is real. After 50+ experiments you stop caring. Automate dashboards, not spreadsheets.
-
Humans lie too. Crowdworkers click fastest to finish—pay by quality, not quantity.
-
Correlation ≠ causation. A model that lifts NDCG may tank downstream conversions. Always run the end-to-end experiment.
-
The best model is the one you can ship. A 10 B monster stuck in staging is worthless next to a 3 B on-device tflite that actually reaches users.
-
Watch the video! Our first YouTube clip walks through picking an LLM with Ollama—perfect companion to this deep dive.
Ready for the wrap-up? Head to the Conclusion for TL;DR takeaways and our favorite links.
🏁 Conclusion: Mastering AI Model Ranking and Evaluation
Phew! We’ve journeyed through the labyrinth of AI model ranking and evaluation metrics, tools, and real-world battle stories. From the classic Precision-Recall duo to the futuristic CrossNDCG and energy-aware metrics, it’s clear: no single metric reigns supreme. Instead, a balanced cocktail of ranking quality, business KPIs, and ethical fairness checks is your secret sauce.
We also saw how live performance data—like tokens per second and latency—can make or break user experience, sometimes more than a tiny bump in NDCG. And that’s why continuous monitoring and automated retraining pipelines are non-negotiable for production-grade AI.
If you’re eyeing a product or framework to help, tools like Evidently AI and DeepEval stand out for their comprehensive metric coverage and ease of integration. Meanwhile, local LLM playgrounds like Ollama paired with GPUs from Amazon or DigitalOcean make prototyping and evaluation accessible.
Remember our teaser about the “best model you can ship”? That’s the real takeaway. The flashiest leaderboard champ is useless if it’s too slow, too costly, or too biased for your users. So, pick metrics aligned with your business goals, automate your evaluation, and keep humans in the loop for sanity checks.
Ready to turn AI insight into your competitive edge? Let’s get ranking! 🚀
📚 Recommended Links for Deep Diving into AI Model Ranking
CHECK PRICE on GPUs and AI Infrastructure:
- NVIDIA A10 GPUs: Amazon | DigitalOcean GPU Droplets | RunPod GPU Instances
👉 Shop AI Model Evaluation Tools:
- Evidently AI: GitHub | Official Site
- DeepEval: PyPI | GitHub
- Ragas: GitHub
- Ollama LLM Playground: Ollama.ai
Must-Read Books on AI Evaluation and Ranking:
- “Information Retrieval: Implementing and Evaluating Search Engines” by Stefan Büttcher, Charles L. A. Clarke, Gordon V. Cormack — Amazon Link
- “Evaluation Methods in Machine Learning” by Nathalie Japkowicz and Mohak Shah — Amazon Link
- “Fairness and Machine Learning: Limitations and Opportunities” by Solon Barocas, Moritz Hardt, Arvind Narayanan — Free Online
❓ Frequently Asked Questions (FAQ) on AI Model Ranking and Evaluation

What role do explainability and interpretability play in the evaluation and ranking of AI models?
Explainability and interpretability help stakeholders understand why a model ranks items as it does. This transparency is crucial for debugging, trust-building, and regulatory compliance. For example, if a recommender system favors certain products, interpretability tools like SHAP or LIME can reveal feature importance, helping detect bias or spurious correlations. Moreover, explainability supports fairness audits and helps non-technical teams align model behavior with business goals.
How can I use techniques like cross-validation to improve the reliability of my AI model evaluations?
Cross-validation partitions your dataset into multiple train-test splits, ensuring your evaluation metrics generalize beyond a single random split. For ranking models, k-fold cross-validation or leave-one-query-out methods help estimate metrics like NDCG or MAP more robustly. This reduces overfitting risk and provides confidence intervals for metric stability. However, be mindful of temporal or domain shifts—cross-validation assumes data is IID, which may not hold in production.
What are some common pitfalls to avoid when evaluating and ranking AI models?
- Ignoring position bias: Naïve CTR or click-based metrics can mislead if you don’t correct for the natural advantage of top-ranked items.
- Overfitting to offline metrics: High offline NDCG doesn’t guarantee better user engagement or revenue. Always validate with online A/B tests.
- Using a single metric: No metric captures all aspects; combining ranking, behavioral, and business KPIs is essential.
- Neglecting fairness and bias: Skipping ethical audits can lead to discriminatory outcomes and reputational damage.
- Data leakage: Ensure your test set is strictly separated to avoid inflated performance estimates.
How can I compare the performance of different AI models on the same dataset?
Use a consistent evaluation protocol: same test set, identical metrics, and fixed hyperparameters. Statistical significance tests (e.g., paired t-test, bootstrap) help determine if observed differences are meaningful. Visualization tools like lift/gain charts or rank correlation plots (Spearman’s rho) provide intuitive comparisons. For ranking models, focus on metrics like NDCG@K, MAP, and MRR, and consider business KPIs to complement offline scores.
What are the differences between accuracy, precision, and recall in AI model ranking?
- Accuracy measures overall correctness but is less informative for ranking tasks with imbalanced relevance.
- Precision is the fraction of retrieved items that are relevant—important when false positives are costly.
- Recall is the fraction of relevant items retrieved—critical when missing relevant items hurts user experience.
Ranking tasks usually prioritize precision@K and recall@K, focusing on the top results rather than overall accuracy.
How do I choose the right evaluation metric for my AI model?
Start by defining your business objective and user experience goals. For example, if users want the first correct answer fast, prioritize MRR or Hit Rate. If you care about overall relevance order, use NDCG or MAP. Incorporate business metrics like CTR or revenue lift, and don’t forget fairness and latency constraints. Finally, consider data availability and explainability needs.
What are the key metrics for evaluating the performance of an AI model?
Key metrics depend on the task but often include:
- Ranking quality: NDCG, MAP, MRR, Precision@K, Recall@K
- Classification quality: AUC-ROC, F1-score, Log Loss
- Business impact: CTR, conversion rate, revenue lift
- System performance: latency, throughput
- Ethical considerations: fairness gap, demographic parity
How does AI model evaluation impact business decision-making?
Accurate evaluation ensures that deployed models truly improve user engagement, revenue, or operational efficiency. It guides resource allocation (e.g., GPU budget), risk management (bias detection), and strategic planning (product roadmap). Poor evaluation leads to wasted investment, user churn, or regulatory penalties. Hence, evaluation metrics become KPIs that align AI efforts with business outcomes.
What methods are used to compare AI model performance effectively?
- Offline evaluation: Using ground-truth test sets and metrics like NDCG, MAP.
- Online A/B testing: Measuring real user behavior (CTR, conversions).
- Statistical tests: Paired t-tests, bootstrap confidence intervals to assess significance.
- Rank correlation: Spearman’s rho, Kendall’s tau to compare orderings.
- Visualization: Lift charts, ROC curves, calibration plots.
How can AI model ranking improve competitive advantage in industry?
By delivering more relevant, timely, and fair results, AI ranking models enhance user satisfaction, increase conversion rates, and reduce churn. They enable personalized experiences at scale, optimize inventory exposure, and uncover hidden opportunities in long-tail data. Companies that master ranking evaluation can iterate faster, reduce costs, and innovate confidently, leaving competitors in the dust.
What role does data quality play in AI model evaluation?
High-quality, representative, and unbiased data is the foundation of reliable evaluation. No metric can salvage a test set riddled with label noise, sampling bias, or outdated relevance judgments. Data quality issues lead to misleading metrics, poor generalization, and flawed business decisions. Continuous data curation and validation are as important as model tuning.
What are the challenges in benchmarking AI models across different domains?
- Heterogeneous data: Different feature spaces, label types, and relevance definitions complicate metric standardization.
- Domain-specific user behavior: Metrics that work for e-commerce may fail in healthcare or legal search.
- Privacy and compliance: Sharing benchmarks can be restricted by regulations.
- Rapid model evolution: Frequent updates require dynamic benchmarks and continuous evaluation.
- Computational cost: Large-scale benchmarks demand significant infrastructure, limiting accessibility.
🔗 Reference Links and Further Reading
- ArtificialAnalysis.ai Leaderboards and Live Metrics
- JAIR Article on Ranking-Based Image Captioning Evaluation
- Evidently AI: 10+ Metrics to Evaluate Recommender and Ranking Systems
- OpenAI GPT-4 Official Site
- Meta AI Llama Models
- Google Gemini AI Models
- Anthropic Claude Models
- NVIDIA Official Website
- DigitalOcean GPU Droplets
- RunPod GPU Cloud
- Ollama LLM Playground
- Fairness and Machine Learning Book
- MLflow Experiment Tracking
For a deep dive into ranking metrics and practical evaluation, Evidently AI’s resource is a must-bookmark:
Evidently AI Ranking Metrics