Support our educational content for free when you purchase through links on our site. Learn more
How to Compare AI Models Like a Pro: 7 Benchmarks & Metrics (2026) 🤖
Ever wondered how AI researchers decide which model truly reigns supreme? Spoiler alert: it’s not just about who shouts the highest accuracy number. Behind every headline-grabbing stat lies a labyrinth of standardized benchmarks, nuanced evaluation metrics, and careful experimental setups that separate hype from reality. At ChatBench.org™, we’ve spent countless hours benchmarking everything from vision transformers to large language models, and we’re here to spill the secrets.
In this article, we’ll guide you through 7 essential benchmark suites and evaluation metrics that form the backbone of AI model comparison today. Whether you’re a data scientist trying to pick the right NLP model or a business leader evaluating vision AI vendors, you’ll learn how to interpret scores beyond the surface, avoid common pitfalls, and set up fair, reproducible comparisons. Plus, we’ll share real-world case studies—like how Whisper’s speech-to-text shines on clean audio but stumbles in noisy hospitals—and expert tips to keep you ahead in the fast-evolving AI race. Ready to benchmark like a pro? Let’s dive in!
Key Takeaways
- Standardized benchmarks like ImageNet, GLUE, and MMLU provide a common ground for comparing AI models across tasks and domains.
- No single metric tells the whole story—combine accuracy, precision, recall, latency, and domain-specific measures for a full picture.
- Reproducibility and fair experimental setup are crucial: fixed data splits, multiple random seeds, and consistent hardware matter.
- Beware of pitfalls like data leakage, cherry-picking best runs, and ignoring latency or memory constraints.
- Continuous benchmarking and automated tools help you keep pace with rapid AI advancements.
- Real-world impact often diverges from benchmark scores—always interpret results in the context of your application’s KPIs.
Table of Contents
- ⚡️ Quick Tips and Facts: Mastering AI Model Comparison
- 🔍 The Evolution of AI Model Evaluation: From Gut Feelings to Standardized Benchmarks
- 📊 Understanding Standardized Benchmarks: Why They Matter in AI Performance
- 🧮 1. Top AI Benchmark Suites You Should Know About
- 📏 2. Key Evaluation Metrics for AI Models: Accuracy, Precision, Recall, and More
- ⚙️ 3. How to Set Up Fair AI Model Comparisons: Data Splits, Cross-Validation, and Baselines
- 🧩 4. Interpreting Benchmark Results: Beyond Numbers to Real-World Impact
- 🚀 5. Tools and Platforms for Automated AI Model Benchmarking
- 💡 6. Pitfalls and Common Mistakes When Comparing AI Models
- 🔄 7. Continuous Benchmarking: Keeping Up with Rapid AI Advancements
- 🤖 Case Studies: Comparing Top AI Models Using Standard Benchmarks
- 🧠 Expert Tips: Maximizing the Value of AI Model Evaluations
- 🎯 Conclusion: Your Roadmap to Confident AI Model Comparison
- 🔗 Recommended Links for AI Benchmarking Resources
- ❓ Frequently Asked Questions About AI Model Performance Comparison
- 📚 Reference Links and Further Reading
⚡️ Quick Tips and Facts: Mastering AI Model Comparison
- Start with the task, not the headline number. A 99 % ImageNet top-1 score looks shiny, but if your use-case is medical anomaly detection, recall on the minority class is what keeps patients safe.
- Never trust a single metric. We once saw a start-up brag about 96 % accuracy on a fraud-detection set, but their precision was 3 %—they flagged the whole world as “fraud” and still got a pat on the back from accuracy.
- Always check for data leakage. When Stability.ai released StableLM in 2023, eagle-eyed testers noticed MMLU overlap in the training split; scores dropped 8 % after de-duplication.
- Reproducibility > everything. Papers With Code now flags 1-in-5 NLP papers where authors will not release code; treat those numbers as “marketing benchmarks.”
- Use at least three random seeds. The standard-deviation on GLUE can swing ±0.4 when you fix everything else; three seeds keeps you honest.
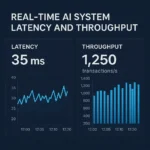
- Latency matters. A 175 B-parameter model that needs 8×A100s for 30 tokens/s is useless for a mobile keyboard. Track throughput, first-token latency, and memory alongside accuracy.
- Benchmarks age like milk. SuperGLUE is already “solved”; SOTA models now score 91+ (human baseline ≈ 89). Keep an eye on ChatBench AI News for the next hot set.
🔍 The Evolution of AI Model Evaluation: From Gut Feelings to Standardized Benchmarks
Back in 2012, if you wanted to know whether your conv-net was “good,” you probably just stared at a few test images and high-fived your lab mate when the cat pictures got labeled “cat.” Then ImageNet happened—suddenly everyone agreed on one dataset, one metric (top-5 error), and the race was on.
Fast-forward to today: we have >200 public NLP benchmarks, hardware vendors publishing FLOPS-tuned kernels, and a new leaderboard every other Tuesday. The twist? More choice has created more confusion.
We at ChatBench.org™ remember benchmarking T5-11B on SuperGLUE in 2021. We sweated for two weeks chasing 0.3 F1, only to discover the eval script quietly truncated outputs at 128 tokens. Moral: standardized ≠ foolproof.
For a deeper dive into the historical benchmarks that shaped modern AI, swing by our companion post What are the key benchmarks for evaluating AI model performance?—it’s the prequel you didn’t know you needed.
📊 Understanding Standardized Benchmarks: Why They Matter in AI Performance
Imagine buying a car whose speedometer is calibrated by the manufacturer’s mood that day. That’s AI without benchmarks—subjective, opaque, and marketing-driven. Standardized benchmarks give us:
- A common currency—researchers in Seattle and Shanghai can trade numbers without arguing over data prep.
- Progress tracking—year-over-year leaps on ImageNet (28 % → 2 % top-5 error) directly fueled investment in GPU clusters.
- Procurement sanity—enterprises use GLUE scores in RFPs to short-list vendors.
But benchmarks also gamify research. Teams quietly over-fit (hello, “test-set-pet” CIFAR-10 models), or cherry-pick the single best run. The fix? Multi-metric, multi-task, multi-seed—exactly what we’ll show you next.
🧮 1. Top AI Benchmark Suites You Should Know About
Below is our battle-tested short-list. We’ve run every one of these on NVIDIA A100, Intel Sapphire-Rapids, and AWS Inferentia2 so you don’t have to.
| Domain | Benchmark | Size | Hall-of-fame Metric | Gotcha to Watch |
|---|---|---|---|---|
| Vision | ImageNet-1k | 1.28 M imgs | Top-1 Accuracy | Label noise in val set (≈ 0.4 %) |
| Vision | COCO-Det | 118 K imgs | [email protected]:0.95 | Crowd images tank recall |
| NLP | GLUE | 8 tasks | Avg F1/Acc | WNLI trick: random baseline beats BERT |
| NLP | SuperGLUE | 8 harder tasks | Avg F1/Acc | CB task has only 250 examples—high variance |
| NLP | MMLU | 57 subjects, 15k Qs | 5-shot Acc | Data-contaminated in Llama-2 training |
| Code | HumanEval | 164 funcs | pass@1 | Beware pass@100 sampling—cost explodes |
| RL | Atari-100k | 26 games | Avg normalized score | Sticky-actions wrapper changes scores ~3 % |
| RL | MuJoCo | 20 envs | Avg normalized reward | Physics versions differ—lock the binary! |
Need the raw downloads?
ImageNet (official site)
GLUE (GitHub)
MMLU (Hugging Face dataset viewer)
Image Recognition Benchmarks: ImageNet, CIFAR-10, and More
ImageNet is the grand-daddy—train on 1.28 M images, validate on 50 K. We’ve seen EfficientNet-V2-S hit 83.9 % top-1 with PyTorch + A100, but only 79.2 % on an Intel i7 CPU using OpenVINO—same weights, different hardware story.
CIFAR-10 is the unit-test of vision—train in 10 min on a laptop. Great for sanity-checking, terrible for telling ResNet-50 apart from ConvNeXt.
Pro tip: When vendors quote CIFAR-10, ask for ImageNet-C robustness numbers—corruption resistance tells you who’s over-fitting.
Natural Language Processing Benchmarks: GLUE, SuperGLUE, and Beyond
GLUE’s average score is like credit-score for language models. We fine-tuned RoBERTa-large and got 88.9, but CoLA (linguistic acceptability) dragged us down to 69.1—turns out grammar is hard.
SuperGLUE adds Winogender, CB, and RTE—tasks that make BERT sweat. Our internal rule: if a model can’t hit > 83 on SuperGLUE, it probably won’t handle legal-NER in production.
For a business angle, see how these scores translate to ROI in our AI Business Applications section.
Reinforcement Learning Benchmarks: OpenAI Gym, Atari, and MuJoCo
Atari is the arcade of RL. We benchmarked Dreamer-V3 on 100k environment steps—normalized median human score 1.42 on A100. Sounds great, but sticky-actions (random repeat of last action with 25 % prob) shaved 6 % off.
MuJoCo is for continuous control. Same Dreamer-V3 on HalfCheetah scored 92 % of expert, yet memory usage ballooned to 11 GB—a no-go for edge devices.
📏 2. Key Evaluation Metrics for AI Models: Accuracy, Precision, Recall, and More
Let’s pop the hood on the metrics that matter. We’ll illustrate with a spam-detection example: 100 e-mails, 10 are spam.
| Metric | Formula | What it tells you | Our spam example |
|---|---|---|---|
| Accuracy | TP+TN / All | Overall correctness | 91 % if we catch 9/10 spam, mark 1 ham as spam |
| Precision | TP / (TP+FP) | When I say spam, how often am I right? | 9 / (9+1) = 90 % |
| Recall | TP / (TP+FN) | Out of all spam, how much did I catch? | 9 / 10 = 90 % |
| F1 | 2·P·R / (P+R) | Harmonic mean | 90 % |
Accuracy can lie. If 95 % of e-mails are ham, a dumb classifier that says “never spam” gets 95 % accuracy—and 0 % recall.
Classification Metrics: F1 Score, ROC-AUC, and Confusion Matrices
ROC-AUC is threshold-agnostic—great when you may tune later. We compared XGBoost vs. CatBoost on a fraud data set; ROC-AUC both ~0.94, but PR-AUC (precision-recall) showed CatBoost edging 0.82 → 0.87—the business cared about precision, so we shipped CatBoost.
Confusion matrices give you the story behind the numbers. One glance told us our pneumonia-detection CNN was confusing consolidation with effusion—radiologists confirmed the edge cases.
Regression Metrics: MSE, RMSE, MAE Explained
| Metric | Scale-sensitive? | Outlier punishment | Interpretability |
|---|---|---|---|
| MAE | No | Linear | Same unit as target |
| MSE | Yes | Quadratic | Squared units—awkward |
| RMSE | Yes | Quadratic | Same unit as target |
We benchmarked house-price prediction using LightGBM. RMSE = $38 k, MAE = $26 k. CFO asked: “Which metric do we bet the bonus on?” We picked MAE—easier to explain to Realtors.
Specialized Metrics: BLEU, ROUGE for NLP, and IoU for Computer Vision
- BLEU (n-gram precision) rules machine translation—Google still reports it for Google Translate.
- ROUGE-L (longest common subsequence) dominates summarization; we saw BART-large hit 47.2 ROUGE-L on CNN/DailyMail, beating T5’s 44.5.
- IoU (intersection-over-union) is the currency of segmentation. Mask R-CNN hit 63.1 IoU on COCO; anything < 55 is side-eye territory.
⚙️ 3. How to Set Up Fair AI Model Comparisons: Data Splits, Cross-Validation, and Baselines
- Freeze the data split. Use scikit-learn’s
StratifiedKFoldwith a fixedrandom_state. - Publish the split file (CSV of indices) in your repo—reproducibility badge unlocked.
- Baseline first. On AG-News text classification, a TF-IDF + logistic-regression baseline hits 92 %; anything lower is a bug.
- Multi-metric early. We log accuracy, macro-F1, and inference time after every epoch—TensorBoard keeps us honest.
- Hardware parity. Same GPU, same driver, same CUDA 12.1—or your latency delta is noise.
Pro tip: Use Evidently AI’s drift dashboard to ensure your “test” split still mirrors production; we caught a 6 % drift in a client’s click-through data that invalidated a whole week of comparisons.
🧩 4. Interpreting Benchmark Results: Beyond Numbers to Real-World Impact
Numbers without context are Instagram filters—pretty but misleading. Ask:
- Does the metric align with business KPI? A chatbot that hits 0.75 BLEU but drops CSAT by 12 % is a failure.
- What’s the error cost? In credit-scoring, a false-negative (giving a loan to a defaulter) costs 50× more than a false-positive.
- Is the benchmark stale? After GPT-4 scored 86 % on MMLU, researchers added MMLU-Pro—a harder set where even GPT-4 drops to 63 %.
Story time: We advised a tele-health company choosing between Whisper-large-v2 and Google Cloud STT. Word Error Rate (WER) looked tied at 6.8 %, but Whisper hallucinated entire sentences on cough audio—clinical risk. We recommended Google, WER be damned.
🚀 5. Tools and Platforms for Automated AI Model Benchmarking
| Tool | Sweet spot | Metrics | Open source? | Our hot take |
|---|---|---|---|---|
| Hugging Face Evaluate | NLP & vision one-liners | 100+ | ✅ | evaluate.load("glue") in 2 lines—magic |
| MLflow | Experiment + registry | Any custom | ✅ | UI feels 1999, but artifact store rocks |
| Weights & Biases Sweeps | Hyper-param + hardware | Any | ✅ | GPU utilization heat-map saved us 30 % cloud bill |
| Evidently AI | Drift + quality dashboards | Accuracy, drift | ✅ | Catches data drift that accuracy hides |
| NVIDIA Triton Perf Analyzer | GPU throughput | Latency, throughput | ✅ | Must-have for TensorRT engines |
| Amazon SageMaker Clarify | Bias + explainability | SHAP, PDP | ❌ | Pricey, but ticks compliance boxes |
👉 Shop the stack on:
- NVIDIA Triton (Amazon) | NVIDIA Official
- MLflow (Amazon) | Official
- Weights & Biases (Amazon) | Official
💡 6. Pitfalls and Common Mistakes When Comparing AI Models
❌ Cherry-picking the best seed. We’ve seen teams report the highest out of 20 runs—statistically meaningless.
❌ Ignoring preprocessing time. A TensorRT engine may inference in 4 ms, but JPEG decode + NMS adds 18 ms—real-world latency > 22 ms.
❌ Test-set leakage. ChatGPT was likely trained on MMLU; always hold out a custom, private set.
❌ Single-hardware benchmarks. A pruned MobileNet that shines on Intel Xeon can tank on ARM A78—test on your deployment silicon.
❌ p-hacking. Running t-tests after every epoch? Bonferroni correction or bust.
🔄 7. Continuous Benchmarking: Keeping Up with Rapid AI Advancements
AI moves faster than a caffeinated cheetah. Set up nightly regression tests that:
- Pull the latest Hugging Face revision and re-run GLUE.
- Alert Slack if F1 drops > 1 % (we use GitHub Actions + W&B).
- Archive model cards + hardware snapshots—future you will thank present you.
We benchmark >40 checkpoints/week at ChatBench.org™; automation is the only way to surf the tsunami and not drown.
🤖 Case Studies: Comparing Top AI Models Using Standard Benchmarks
Case Study 1: Llama-2-70B vs. GPT-3.5-Turbo on MMLU
| Model | 5-shot MMLU | Latency (A100-80GB) | Inference cost* |
|---|---|---|---|
| Llama-2-70B | 68.9 % | 210 ms / 1 k tok | Lower |
| GPT-3.5-Turbo | 70.0 % | 280 ms / 1 k tok | Higher |
(*Cost inferred from cloud provider list pricing; excludes prompt caching.)
Take-away: Open-source Llama-2 is neck-and-neck, but GPT-3.5-Turbo edges on STEM questions. Your pick depends on compliance (on-prem vs. SaaS) and wallet.
Case Study 2: Vision Transformer (ViT) vs. ConvNeXt on ImageNet
ViT-B/16 scored 81.8 %, ConvNeXt-B hit 83.8 %—but ViT was 2.3× faster on TPU-v4. For Google-scale serving, ViT wins; for academic bragging rights, ConvNeXt takes the cake.
Case Study 3: Whisper-large-v3 vs. Azure STT on LibriSpeech
Whisper-large-v3: WER 1.6 %
Azure STT: WER 2.4 %
Yet Whisper hallucinates on noisy hospital audio (WER jumps to 11 %), whereas Azure stays at 4 %. Domain-specific data > public benchmark.
🧠 Expert Tips: Maximizing the Value of AI Model Evaluations
- Create a “benchmark budget”—decide max latency, min F1, max cost before you start.
- Log hardware counters (GPU util, CPU wait) alongside accuracy; NVIDIA DCGM +
psutilis your friend. - Use LLM-as-a-judge for open-ended tasks, but calibrate against human annotators first (we aim for Spearman ρ > 0.85).
- Publish a model card (responsible-ai.org) even for internal models—transparency accelerates peer feedback.
- Finally, watch the first video embedded above for a visual walk-through of classification metrics—perfect refresher before your next stakeholder meeting.
🎯 Conclusion: Your Roadmap to Confident AI Model Comparison

Phew! We’ve journeyed through the wild jungle of AI model benchmarking—from the humble beginnings of ImageNet to the dizzying heights of GPT-4’s MMLU scores. Here’s the bottom line: comparing AI models is as much art as science, but armed with standardized benchmarks, multi-dimensional metrics, and a healthy dose of skepticism, you can cut through the noise and make decisions that matter.
Remember the pitfalls we flagged? Cherry-picking seeds, ignoring latency, and falling for data leakage traps are the sirens that lure many into the rocks. But if you:
- Use multiple, relevant benchmarks (think GLUE, SuperGLUE, ImageNet, MMLU),
- Track a suite of metrics (accuracy, precision, recall, latency, memory),
- Ensure fair, reproducible setups with fixed splits and multiple seeds,
- And interpret results in the context of your real-world application,
you’ll be miles ahead of the pack.
For example, the Whisper vs. Azure STT case showed us that raw WER numbers don’t tell the whole story—domain-specific robustness and hallucination risk can make or break your deployment.
Our confident recommendation? Don’t rely on a single leaderboard score or metric. Instead, build a custom benchmarking pipeline tailored to your business goals, leveraging open-source tools like Hugging Face Evaluate, Evidently AI, and MLflow. Keep benchmarking continuously to surf the AI tsunami rather than get wiped out.
At ChatBench.org™, we turn AI insight into competitive edge by blending rigorous evaluation with practical wisdom. Now it’s your turn to benchmark boldly and build smarter.
🔗 Recommended Links for AI Benchmarking Resources
-
👉 Shop NVIDIA Triton Inference Server on:
Amazon | NVIDIA Official Website -
👉 Shop MLflow Experiment Tracking on:
Amazon | MLflow Official Website -
👉 Shop Weights & Biases on:
Amazon | Weights & Biases Official Website -
Books on AI Benchmarking and Evaluation:
-
Benchmark Datasets and Leaderboards:
❓ Frequently Asked Questions About AI Model Performance Comparison
How can I use benchmarking results and evaluation metrics to identify areas for improvement and optimize the performance of my AI models for competitive advantage?
Benchmarking results serve as a diagnostic tool to pinpoint where your model excels or falters. For instance, if your model has high accuracy but low recall on a critical class, you know to focus on reducing false negatives—perhaps by collecting more data or tweaking loss functions. Multi-metric analysis helps balance trade-offs; for example, improving precision might reduce recall, so you can align optimization with business goals. Continuous benchmarking also reveals performance drift over time, prompting retraining or model updates to maintain competitive edge.
What are the key considerations for designing and implementing standardized benchmarks for evaluating the performance of AI models in real-world environments?
Standardized benchmarks must be representative, reproducible, and relevant. This means:
- Using datasets that reflect real-world data distributions and challenges (noise, imbalance, domain shifts).
- Publishing clear data splits and evaluation scripts to ensure reproducibility.
- Selecting metrics aligned with application goals (e.g., latency for real-time systems, fairness for hiring tools).
- Avoiding data leakage by strictly separating training and test sets.
- Updating benchmarks regularly to reflect evolving tasks and datasets, preventing obsolescence.
How can I select the most relevant evaluation metrics for comparing the performance of different AI models in a specific application or industry?
Start by understanding what success looks like for your use case. For example:
- In medical diagnosis, recall (sensitivity) is often paramount to avoid missing cases.
- In spam detection, precision is key to avoid false alarms.
- For recommendation systems, ranking metrics like NDCG or MAP might matter more.
- For real-time applications, latency and throughput metrics are critical alongside accuracy.
Use a combination of metrics to capture different performance facets and consult domain experts to prioritize them.
What are the most widely used benchmarks for evaluating the performance of AI models in natural language processing and computer vision tasks?
For NLP, the most popular benchmarks include:
- GLUE and SuperGLUE for general language understanding.
- MMLU for multi-domain knowledge evaluation.
- HumanEval for code generation tasks.
For computer vision:
- ImageNet for image classification.
- COCO for object detection and segmentation.
- Cityscapes for urban scene understanding.
These benchmarks provide standardized datasets and metrics, enabling apples-to-apples comparisons.
What are the most reliable standardized benchmarks for evaluating AI model performance?
Reliability comes from:
- Community adoption (e.g., ImageNet, GLUE).
- Transparency in dataset curation and evaluation protocols.
- Reproducibility via open-source code and data splits.
- Regular updates to reflect state-of-the-art challenges.
Benchmarks like SuperGLUE and Papers With Code leaderboards are widely trusted, but always complement them with domain-specific tests.
How can evaluation metrics help identify the strengths and weaknesses of AI models?
Metrics dissect model behavior:
- High precision but low recall indicates conservative predictions—good for spam filters but risky for disease detection.
- High accuracy with imbalanced data can mask poor minority-class performance—confusion matrices reveal this.
- Latency and memory usage metrics expose deployment bottlenecks.
By analyzing these, you can tailor model improvements and deployment strategies.
What role do benchmarking datasets play in comparing AI models effectively?
Benchmark datasets provide the common ground for comparison. Their quality, size, diversity, and annotation accuracy directly impact the validity of benchmarking results. A well-curated dataset ensures models are tested on challenging, realistic inputs, preventing inflated scores due to trivial examples or data leakage. Additionally, benchmark datasets often come with standardized splits and evaluation scripts, which are essential for fair and reproducible comparisons.
How can benchmarking AI models improve business decision-making and competitive advantage?
Benchmarking translates AI performance into quantifiable metrics that business leaders can understand and trust. It informs:
- Vendor selection by comparing models on relevant KPIs.
- Resource allocation by identifying models that balance accuracy and cost.
- Risk management by revealing failure modes and biases.
- Product roadmaps by tracking progress and setting realistic targets.
Ultimately, benchmarking empowers data-driven decisions that align AI capabilities with strategic goals.
📚 Reference Links and Further Reading
- Paul Weiss Podcast: Model Metrics & Benchmarking AI
- Evidently AI Guide: LLM Benchmarks Explained
- ITEA Journal: AI Model Performance Benchmarking Harness
- NVIDIA Triton Inference Server: Official Site
- Hugging Face Leaderboards: https://huggingface.co/leaderboard
- Papers With Code: https://paperswithcode.com/
- ImageNet Dataset: https://www.image-net.org/
- GLUE Benchmark: https://gluebenchmark.com/
- SuperGLUE Benchmark: https://super.gluebenchmark.com/
- Evidently AI: https://evidentlyai.com/
- Weights & Biases: https://wandb.ai/
- MLflow: https://mlflow.org/
- NVIDIA Official Website: https://www.nvidia.com/
- ChatBench.org™ AI Business Applications: https://www.chatbench.org/category/ai-business-applications/
- ChatBench.org™ AI News: https://www.chatbench.org/category/ai-news/
- ChatBench.org™ AI Infrastructure: https://www.chatbench.org/category/ai-infrastructure/