Support our educational content for free when you purchase through links on our site. Learn more
🚧 15 AI Model Evaluation Pitfalls That Skew Rankings

The best way to avoid common pitfalls when evaluating and ranking AI models is to define success before testing, use clean and representative data, and look beyond a single benchmark score. A high score is only useful if it reflects real-world performance, holds up across important groups, and fits your operational constraints.
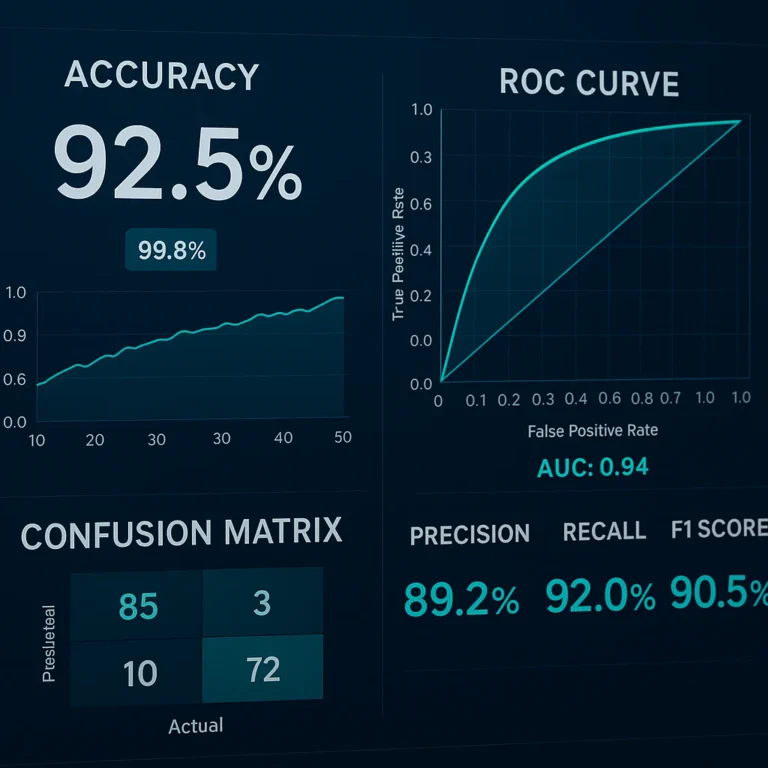
A model can appear 99% accurate and still miss every case you care about: if defects make up just 1% of examples, a system that labels everything “not defective” reaches 99% accuracy without detecting a single defect. That’s the sort of leaderboard magic trick we want to catch before it reaches production.
Key Takeaways
- Define what “better” means first. Match metrics to the task, error costs, and people affected.
- Protect evaluation data. Prevent leakage, duplicates, unrepresentative samples, and repeated tuning against the test set.
- Look beyond averages. Inspect subgroup results, rare failures, uncertainty, calibration, and real examples.
- Compare candidates under identical conditions. Freeze data, prompts, thresholds, preprocessing, and evaluation settings.
- Rank with a transparent scorecard. Include quality, safety, reliability, latency, and operational trade-offs.
- Keep evaluating after launch. Monitor drift, review failures, and re-test when models, data, or workflows change.
Table of Contents
- ⚡️ Quick Tips and Facts
- 🧭 AI Model Evaluation: Background, Goals, and Key Terms
- What model evaluation can—and cannot—tell you
- How offline benchmarks differ from real-world performance
- 🚧 15 Common Pitfalls When Evaluating and Ranking AI Models
- 1. Using a test set that is too small or unrepresentative
- 2. Leting data leakage contaminate evaluation
- 3. Overfitting to a public benchmark or leaderboard
- 4. Choosing metrics that do not match the task
- 5. Treating accuracy as the whole story
- 6. Ignoring class imbalance and rare failures
- 7. Comparing models on inconsistent data or settings
- 8. Relying on averages that hide weak slices
- 9. Confusing correlation with meaningful improvement
- 10. Ignoring uncertainty and statistical significance
- 11. Neglecting calibration, confidence, and decision thresholds
- 12. Overlooking human, operational, and inference costs
- 13. Missing fairness, privacy, safety, and security risks
- 14. Treating one evaluation run as proof of production readiness
- 15. Ranking models without documenting assumptions and trade-offs
- 🧪 A More Reliable AI Model Evaluation Workflow
- Define the use case, users, and acceptable failure modes
- Build a trustworthy test set and protect the holdout
- Choose task-appropriate metrics and baselines
- Score models, inspect slices, and review failure cases
- Compare candidates fairly and quantify uncertainty
- Set thresholds and evaluate the full decision system
- Monitor drift and re-evaluate after deployment
- 📊 Evaluation Methods by AI Task
- Classification, ranking, and regression
- Large language models and generative AI
- Computer vision and multimodal models
- Recommendation systems and search
- Robotics, agents, and decision-making policies
- 🧮 Metrics That Matter: Accuracy, F1, AUC, Calibration, and Beyond
- Match metrics to error costs and business outcomes
- Use precision, recall, and confusion matrices wisely
- Measure latency, reliability, and resource use
- 🧰 Test Data, Train-Test Splits, and Cross-Validation
- Prevent leakage across users, time, and near-duplicate examples
- Choose random, stratified, group, or time-based splits
- Handle small datasets and changing data distributions
- ⚖️ Fairness, Robustness, Safety, and Responsible AI Evaluation
- Test subgroup performance and intersectional differences
- Probe distribution shifts, adversarial inputs, and edge cases
- Evaluate privacy, toxicity, hallucinations, and harmful outputs
- 🏆 How to Rank AI Models Without Misleading Yourself
- Build a scorecard instead of trusting one leaderboard number
- Weight criteria transparently and test ranking sensitivity
- Report confidence intervals, trade-offs, and practical significance
- 🔁 Production Evaluation, Monitoring, and Model Drift
- Monitor data quality, drift, and changing user behavior
- Use human review and feedback loops responsibly
- Set re-evaluation triggers and rollback criteria
- 🛠️ Tools and Practical Resources for Model Evaluation
- Open-source evaluation and experiment-tracking tools
- Dataset versioning, error analysis, and model monitoring
- Conclusion
- Recommended Links
- FAQ
- Reference Links
Table of Contents
- ⚡️ Quick Tips and Facts
- 🧭 AI Model Evaluation: Background, Goals, and Key Terms
- What model evaluation can—and cannot—tell you
- How offline benchmarks differ from real-world performance
- 🚧 15 Common Pitfalls When Evaluating and Ranking AI Models
- 1. Using a test set that is too small or unrepresentative
- 2. Leting data leakage contaminate evaluation
- 3. Overfitting to a public benchmark or leaderboard
- 4. Choosing metrics that do not match the task
- 5. Treating accuracy as the whole story
- 6. Ignoring class imbalance and rare failures
- 7. Comparing models on inconsistent data or settings
- 8. Relying on averages that hide weak slices
- 9. Confusing correlation with meaningful improvement
- 10. Ignoring uncertainty and statistical significance
- 11. Neglecting calibration, confidence, and decision thresholds
- 12. Overlooking human, operational, and inference costs
- 13. Missing fairness, privacy, safety, and security risks
- 14. Treating one evaluation run as proof of production readiness
- 15. Ranking models without documenting assumptions and trade-offs
- 🧪 A More Reliable AI Model Evaluation Workflow
- Define the use case, users, and acceptable failure modes
- Build a trustworthy test set and protect the holdout
- Choose task-appropriate metrics and baselines
- Score models, inspect slices, and review failure cases
- Compare candidates fairly and quantify uncertainty
- Set thresholds and evaluate the full decision system
- Monitor drift and re-evaluate after deployment
- 📊 Evaluation Methods by AI Task
- Classification, ranking, and regression
- Large language models and generative AI
- Computer vision and multimodal models
- Recommendation systems and search
- Robotics, agents, and decision-making policies
- 🧮 Metrics That Matter: Accuracy, F1, AUC, Calibration, and Beyond
- Match metrics to error costs and business outcomes
- Use precision, recall, and confusion matrices wisely
- Measure latency, reliability, and resource use
- 🧰 Test Data, Train-Test Splits, and Cross-Validation
- Prevent leakage across users, time, and near-duplicate examples
- Choose random, stratified, group, or time-based splits
- Handle small datasets and changing data distributions
- ⚖️ Fairness, Robustness, Safety, and Responsible AI Evaluation
- Test subgroup performance and intersectional differences
- Probe distribution shifts, adversarial inputs, and edge cases
- Evaluate privacy, toxicity, hallucinations, and harmful outputs
- 🏆 How to Rank AI Models Without Misleading Yourself
- Build a scorecard instead of trusting one leaderboard number
- Weight criteria transparently and test ranking sensitivity
- Report confidence intervals, trade-offs, and practical significance
- 🔁 Production Evaluation, Monitoring, and Model Drift
- Monitor data quality, drift, and changing user behavior
- Use human review and feedback loops responsibly
- Set re-evaluation triggers and rollback criteria
- 🛠️ Tools and Practical Resources for Model Evaluation
- Open-source evaluation and experiment-tracking tools
- Dataset versioning, error analysis, and model monitoring
- Conclusion
- Recommended Links
- FAQ
- Reference Links
⚡️ Quick Tips and Facts
If you’re comparing models for a real deployment, start with our guide to AI model ranking and evaluation. The short version: the best model is not necessarily the one with the highest benchmark score; it’s the one that meets your use-case requirements reliably, fairly, and within operational constraints.
| Quick check | Why it matters | Practical move |
|---|---|---|
| ✅ Define success before testing | Metrics chosen after seeing results invite cherry-picking | Write down the task, acceptable errors, and deployment constraints first |
| ✅ Keep test data independent | Leakage and repeated test-set tuning can inflate results | Use validation data for tuning; reserve a sealed test set for final checks |
| ✅ Report more than one score | Averages can hide critical errors and weak subgroups | Include task metrics, slices, failure examples, latency, and uncertainty |
| ✅ Compare identical conditions | Different prompts, thresholds, or datasets make rankings unfair | Version the data and freeze evaluation settings |
| ✅ Inspect failures manually | A number says how much failed, not why | Review false positives, false negatives, and disputed outputs |
| ✅ Re-test after launch | Data, users, and infrastructure change | Monitor drift and maintain a regression test set |
A few facts worth keeping in your back pocket:
- Accuracy can look excellent while a model is useless. If only 1% of manufactured parts are defective, a model that always predicts “not defective” can reach 99% accuracy while detecting zero defects.
- Test-set labels are not automatically ground truth. An analysis of 10 widely used image benchmarks found an average of at least 3.3% label errors in their test sets, according to the benchmark re-examination research.
- Repeatedly consulting a test set turns it into a tuning tool. The more model or threshold decisions you make based on test results, the less independent that final score becomes. See the classic paper on overfitting to a test set.
- A small slice needs a big asterisk. Thirty examples can reveal a possible concern, but rarely justify treating a small score difference as a settled fact.
We’ll return to a question that looks simple but causes a surprising number of bad rankings: what exactly counts as “better” when two models trade quality for speed, cost, or reliability? Hold that thought.
🧭 AI Model Evaluation: Background, Goals, and Key Terms

AI model evaluation is the process of measuring how well a model performs against a defined task, dataset, and set of constraints. Ranking models means comparing candidates using those measurements. The distinction matters: an evaluation can be accurate while the ranking rule is poorly designed.
For example, a team might correctly measure that Model A is more accurate than Model B on a benchmark, then still choose poorly if Model A is too slow for an interactive product or performs badly on a group the product must serve.
What model evaluation can—and cannot—tell you
A model evaluation can help you estimate:
- Task performance: Does the system classify, predict, retrieve, generate, or act successfully?
- Reliability: Does it behave consistently across repeated runs and ordinary variations input?
- Robustness: Does performance hold under noise, distribution shifts, or unusual but realistic cases?
- Operational fit: Does it meet latency, throughput, memory, safety, privacy, and cost constraints?
- Known limitations: Which cases, groups, or conditions produce failures?
It cannot prove that a model will always behave well, nor can a single score establish that a system is safe in every context. Evaluation is evidence for a decision, not a magical certificate. The NIST AI Risk Management Framework treats measurement as part of an ongoing process of managing risk, rather than a one-time approval ritual.
A model is also only one part of a deployed system. Preprocessing, retrieval, prompts, thresholds, human review, and downstream actions can all change the result. For an AI assistant, evaluating the base language model but not its retrieval pipeline is like reviewing a chef’s knife while ignoring the kitchen.
How offline benchmarks differ from real-world performance
A benchmark is a standardized test: useful for controlled comparisons, but only as representative as its data and rules. Real-world performance depends on who uses the system, how inputs arrive, what happens after a prediction, and whether the operating environment changes.
| Evaluation setting | What it’s good for | Common blind spot |
|---|---|---|
| Public benchmark | Reproducible, familiar comparison | Contamination, narrow coverage, or mismatch with your use case |
| Internal holdout test | Testing against your collected examples | May still miss rare conditions or contain leakage |
| Expert review | Contextual judgment and nuanced quality | Cost, subjectivity, and disagreement between reviewers |
| Pilot or shadow deployment | Realistic operational signals | Limited duration, selection effects, or incomplete outcome labels |
| Production monitoring | Detecting changes after release | Some outcomes arrive late; harmful errors need safeguards immediately |
A benchmark score answers, “How did this model perform under these benchmark rules?” It does not answer, “How will this model perform on our users, data, and workflow?” Research comparing original and rebuilt benchmark test sets has found meaningful accuracy declines, reinforcing why benchmark results should be treated as useful evidence—not a field guarantee.
🚧 15 Common Pitfalls When Evaluating and Ranking AI Models
These pitfalls show up in research labs, product teams, and procurement reviews. Some produce flattering numbers. Others create the opposite problem: rejecting a useful model because the measurement setup was noisy or unfair.
1. Using a test set that is too small or unrepresentative
A small test set gives each example an outsized influence. If a model gets 9 out of 10 examples right, the observed score is 90%, but the true performance could plausibly be much lower or higher. The uncertainty is especially serious when the set contains few examples from important user groups, locations, rare classes, or failure conditions.
Avoid it:
- Size the test set around the precision you need, not convenience.
- Include realistic variation: device types, regions, languages, lighting, user intents, and edge cases as relevant.
- Report sample counts beside every subgroup score.
- Treat low-count slices as signals for investigation, not definitive league tables.
A representative test set is not necessarily a miniature copy of the overall population. For safety-critical or high-impact groups, you may need deliberate oversampling so you can estimate performance with useful precision.
2. Leting data leakage contaminate evaluation
Data leakage happens when information that should be unavailable during training or tuning influences the evaluation result. It can occur through duplicate examples, shared users, future information, preprocessing mistakes, or overly broad access to the test set.
Imagine splitting individual frames from the same driving video across training and test data. The model may see nearly identical scenes in both sets. The score can look impressive while measuring familiarity, not generalization.
Avoid it:
- Split at the right unit: by user, patient, recording, device, location, or time period.
- Search for exact and near-duplicate examples, including with embeddings.
- Fit scaling, imputation, vocabulary, and feature selection on training data only.
- Keep the test set sealed; use validation data for model selection and threshold tuning.
Near-duplicates are not merely theoretical. CIFAR re-examination work identified near-duplicate images affecting 3.3% of CIFAR-10 and 10% of CIFAR-100 test images; see the study on duplicate images in common benchmarks.
3. Overfitting to a public benchmark or leaderboard
A leaderboard can become a target, and targets get optimized. Teams may choose architectures, prompts, thresholds, or training recipes based on repeated benchmark feedback until the benchmark score no longer reflects an independent test.
This is one reason benchmark rankings can shift when test data is reconstructed or refreshed. The leaderboard may still be useful for tracking progress, but its score is not a universal model quality rating.
Avoid it:
- Use public benchmarks for orientation, not as your only selection criterion.
- Maintain private, representative evaluation data.
- Track whether a candidate has seen benchmark examples during training or development.
- Validate the final choice on a fresh holdout or a controlled pilot.
4. Choosing metrics that do not match the task
Metrics are not interchangeable badges. BLEU may be useful for certain machine-translation comparisons, but it does not capture every aspect of translation quality. Accuracy can suit balanced classification, while missing the point entirely in rare-event detection. A summarizer may need factual consistency and coverage, not just a similarity score against one reference.
Write down the decision the model supports, then choose metrics that reflect the consequences of its mistakes. The scikit-learn metrics guide is a useful reference for common supervised-learning measures and their assumptions.
5. Treating accuracy as the whole story
Accuracy is the share of predictions that are correct. It can be informative, but it treats every error alike and can be badly misleading under class imbalance.
A classifier that misses every rare but dangerous event may still earn a handsome accuracy score. That is a tidy number attached to a messy failure.
Add measures that expose what accuracy hides:
- Precision: When the model flags something, how often is it right?
- Recall: Of the important cases, how many does it find?
- F1 score: A harmonic mean of precision and recall, useful when both matter.
- PR-AUC: Often more informative than ROC-AUC for highly imbalanced positive classes.
- Cost-weighted error: How costly are the specific false positives and false negatives?
6. Ignoring class imbalance and rare failures
In imbalanced datasets, common classes dominate aggregate results. The model may perform well on routine examples while failing on a small but consequential category.
Do not “fix” this by looking only at a balanced test set if the live system will face a different prevalence. Instead, report both:
- Operational performance under realistic class frequencies.
- Diagnostic performance on deliberately balanced or enriched slices.
This gives decision-makers both the real-world picture and enough rare examples to examine. For more on choosing thresholds as prevalence changes, see the Google Machine Learning Crash Course guide to classification thresholds.
7. Comparing models on inconsistent data or settings
A comparison is not fair if one candidate gets a different dataset, prompt, preprocessing pipeline, decoding setting, confidence cutoff, or annotation policy. The small differences can add up to a bigger advantage than the model improvement itself.
Freeze and record:
- Dataset version and split
- Preprocessing and postprocessing
- Prompt, system instructions, and retrieval configuration
- Random seeds and decoding settings
- Confidence thresholds and metric implementation
- Hardware, runtime, and software versions
If these aren’t the same, you may be ranking evaluation setups rather than models.
8. Relying on averages that hide weak slices
An overall score can conceal poor results for a particular class, camera, language, age group, lighting condition, or region. A model with impressive average performance may fail exactly where the impact is highest.
Choose slices based on credible deployment risks—not just whichever metadata happens to be handy. Report the count, score, uncertainty, and practical consequence for each key slice. Thirty examples with an 85% score versus 92% is a reason to gather more evidence, not to declare a winner.
9. Confusing correlation with meaningful improvement
A higher benchmark score is not automatically a meaningful improvement. The change might be smaller than run-to-run variation, depend one lucky seed, or improve a proxy metric without improving the actual user outcome.
Ask:
- Is the difference statistically distinguishable from noise?
- Does it matter operationaly?
- Is the gain consistent across important slices?
- Did the model improve the real task or only a convenient proxy?
A statistically detectable change can still be too small to justify a costly migration. Conversely, a modest aggregate change can be important if it reduces a severe failure mode.
10. Ignoring uncertainty and statistical significance
Every evaluation score has uncertainty. Small samples, correlated examples, random initialization, and stochastic outputs all affect how confidently you can compare candidates.
Use confidence intervals or suitable resampling methods, and account for clustered data. If several examples come from the same person, location, or video, treating them as independent can make uncertainty look artificially small.
For repeated model training, test multiple seeds when practical. If two models’ differences are smaller than the variation between repeated runs of the same setup, calling one a clear winner is overconfident.
11. Neglecting calibration, confidence, and decision thresholds
A confidence score is useful only if it means something. A model that predicts 90% confidence should be correct about 90% of the time on comparable examples if it is well calibrated.
Poor calibration can make automated triage, human escalation, and risk-based thresholds unreliable. Evaluate calibration with tools such as reliability diagrams and the Brier score, and choose operating thresholds on validation data—not the final test set.
Recheck thresholds after retraining or a shift input prevalence. A threshold is not a family heirloom.
12. Overlooking human, operational, and inference costs
A model that wins on quality but misses the latency budget may not be deployable. A slightly less accurate system may serve more users if it is faster, cheaper to operate, easier to maintain, or less dependent on scarce expert review.
Assess the whole system:
- Latency and throughput
- Compute, memory, and energy requirements
- Human review and correction time
- Integration and maintenance burden
- Failure recovery and fallback behavior
For many teams, the practical question is not “Which model has the highest score?” but “Which model provides the strongest dependable outcome within our constraints?”
13. Missing fairness, privacy, safety, and security risks
A model can look strong overall and still perform unevenly across groups or expose users to unacceptable harm. Evaluation should examine relevant subgroup performance, privacy risks, harmful outputs, and security weaknesses.
The right checks depend on the application. A hiring model needs different fairness analysis from an industrial defect detector; a customer-service assistant needs different safety tests from a clinical decision-support system. The NIST AI RMF offers a broad structure for identifying and managing AI risks.
14. Treating one evaluation run as proof of production readiness
Models can change behavior with different seeds, prompts, input formats, traffic patterns, or infrastructure. A single clean test run rarely covers the conditions users will create.
For interactive and generative systems, evaluate repeated trials, realistic conversations, long-tail inputs, and downstream outcomes. For physical systems, test across rollouts and environmental perturbations. A neat demo is not a reliability study.
15. Ranking models without documenting assumptions and trade-offs
A single composite score can make subjective priorities look objective. If you combine quality, latency, cost, and safety, document the weights and explain who chose them.
A transparent scorecard lets a team see why one candidate ranks first and whether the ranking would change under different priorities. If moving a weight slightly reshuffles the top three, report that sensitivity instead of presenting the winner as inevitable.
🧪 A More Reliable AI Model Evaluation Workflow
A sound evaluation workflow is less about finding a perfect metric and more about reducing avoidable uncertainty, step by step. The Voxel51 guide to evaluating AI models accurately similarly emphasizes task-specific metrics, clean splits, slice analysis, and production-aware testing.
Define the use case, users, and acceptable failure modes
Before running a model, write a short evaluation brief:
- What decision or task does the model support?
- Who uses it, and who may be affected by errors?
- Which failures are most costly?
- What conditions will it face in deployment?
- What latency, privacy, reliability, or infrastructure constraints apply?
- What evidence would justify shipping, refining, or stopping?
This turns “best performance” into a testable definition. It also prevents choosing the metric after learning which one makes the preferred model look good.
For broader practical coverage, follow AI business applications where evaluation requirements connect to customer outcomes, workflow design, and operational fit.
Build a trustworthy test set and protect the holdout
Separate your data into training, validation, and test sets according to how the system will encounter new examples. Use validation data for architecture choices, tuning, prompt edits, and threshold selection. Keep the test set for limited, final comparisons.
A useful dataset checklist:
- Is the test set representative of the intended use?
- Are labels defined with clear annotation guidance?
- Were ambiguous examples reviewed by suitable experts?
- Are duplicate or related samples grouped together?
- Is the test set versioned and access controlled?
- Are sensitive data and retention needs handled appropriately?
Don’t assume labels are infallible. When reviewers disagree, record the disagreement and determine whether it reflects ambiguity, inadequate instructions, or a genuine boundary case.
Choose task-appropriate metrics and baselines
Define a primary metric and supporting measures before comparing candidates. Establish a baseline, too: the current production model, a simple heuristic, or a majority-class predictor can reveal whether a sophisticated model is actually adding value.
| Task or decision | Useful starting metrics | Important companion checks |
|---|---|---|
| Imbalanced classification | Precision, recall, PR-AUC | Per-class results, calibration, threshold costs |
| Balanced classification | Accuracy, macro-F1 | Confusion matrix, subgroup results |
| Regression | MAE, RMSE | Residuals by range, calibration where applicable |
| Search or recommendation | NDCG, Recall@K, MRR | Coverage, diversity, cold-start performance |
| Text generation | Task-specific rubric, factuality checks | Human review, consistency, safety, latency |
| Defect detection | Recall, precision, IoU or mAP | Defect-level and report-level success |
There is no universal metric menu that solves every problem. Metrics should follow the task, error costs, and user expectations.
Score models, inspect slices, and review failure cases
Start with the overall score, then break it down across meaningful conditions. Always inspect examples behind the weakest results. A false negative caused by a blurry sensor image calls for a different fix from a false negative caused by an incorrect label.
A practical failure-review loop:
- Sort errors by severity and slice.
- Inspect false positives, false negatives, and uncertain outputs.
- Identify root causes: label noise, data gaps, domain shift, model limitations, or system integration.
- Choose a targeted response.
- Add verified failures to a regression set.
- Re-evaluate after the change.
The Voxel51 article describes the value of finding the “bucket with the most samples” before collecting more data blindly. That is sound advice: more labels only help if the current bottleneck is missing or inadequate data.
Compare candidates fairly and quantify uncertainty
Run candidates on the same versioned data and frozen settings. For stochastic systems, repeat runs or generations where relevant. Compare paired results on the same examples, because a model’s wins and losses on identical cases can be more informative than comparing unrelated averages.
For each difference, report:
- Point estimate and uncertainty interval
- Number of examples and relevant slices
- Variation across seeds or repeated trials
- Practical impact, not just statistical significance
- Cases where the models disagree
If a new model improves overall performance but regresses sharply on an important slice, the team needs to see both facts—not just the number that looks nicest in a slide deck.
Set thresholds and evaluate the full decision system
Model output is often only the start of a decision. The threshold determines what gets flagged, approved, escalated, or sent to a human reviewer.
Choose thresholds on validation data to satisfy a real operational target, such as:
- Meet a minimum recall requirement while limiting false alerts.
- Keep the human review queue within capacity.
- Escalate low-confidence or high-risk cases.
- Abstain when the model cannot provide adequate evidence.
Then test the end-to-end system, including review steps, fallback paths, and what happens when the model is unavailable. For AI systems that use tools or automated actions, see our coverage of AI agents.
Monitor drift and re-evaluate after deployment
A successful launch is the start of a new measurement phase. Inputs can shift as users change, products evolve, seasons turn, or upstream systems are updated.
Set up monitoring for:
- Input quality and missing fields
- Distribution shifts in features or outputs
- Confidence and abstention rates
- Human corrections and user feedback
- Latency, failures, and downstream outcomes
- Performance on fresh, reviewed samples
Preserve a stable regression set so you can detect regressions, but also collect fresh data to check whether the old test set still reflects reality. A versioned, regularly refreshed evaluation loop is more informative than annual “all good” spreadsheet.
📊 Evaluation Methods by AI Task
Different AI tasks need different evidence. A classification metric cannot capture the quality of a long-form answer, and a language-model rubric is not a substitute for testing whether a robot completes its task.
Classification, ranking, and regression
For classification, examine the confusion matrix and class-specific precision and recall. For ranking, measure whether relevant results appear near the top. For regression, inspect errors across the target range: a low average error can hide severe underprediction for high-value cases.
Helpful checks by task:
- Classification: confusion matrix, precision, recall, F1, PR-AUC, calibration
- Ranking: NDCG, MAP, MRR, Recall@K
- Regression: MAE, RMSE, residual distribution, subgroup error
- Anomaly detection: detection rate, false-alarm rate, detection delay, alert burden
Always pair the metric with an operational interpretation. “Recall improved by four points” is more useful when you also explain how many additional relevant cases were found and how many extra alerts resulted.
Large language models and generative AI
Generative models create outputs that may be valid in many different ways. Automated reference-based metrics can miss factual errors, tone problems, instruction failures, or subtle safety issues.
A robust LM evaluation often combines:
- Objective tests: code execution, exact-match checks, structured-output validation, or database verification.
- Human review: domain experts or trained raters assess relevance, clarity, factuality, tone, and safety.
- Rubric-based model judging: useful at scale, but calibrated against human judgments and checked for systematic bias.
- Repeated trials: measure consistency when outputs are stochastic.
- Adversarial and long-context tests: probe difficult or manipulative inputs.
- System-level checks: evaluate retrieval, tools, prompts, and escalation behavior alongside the base model.
Automated judges are convenient, not infallible. Fusefy’s discussion of AI evaluation pitfalls warns that a language-model judge can apply generic criteria to specialized work. Use a task-specific rubric, compare judge ratings to expert-labeled samples, and audit disagreement.
The first YouTube video, “3 Common LM Evaluation Mistakes and How to Avoid Them,” offers a helpful companion on common LM testing errors. It’s worth watching alongside your own rubric design—but, naturally, the video itself is not a substitute for validating your evaluator against your use case.
Computer vision and multimodal models
For computer vision, report metrics suited to the output: classification accuracy, object-detection mAP, segmentation IoU, or task-specific success. Then inspect performance by object size, lighting, camera, scene, and class.
A high image-level score may still miss the real operational question. In inspection, for instance, a company may care whether every defect in a report was found—not just the average score for individual images.
For multimodal systems, test interactions between modalities: Does a vision-language model answer based on the image, or merely echo a tempting phrase in the text? Test missing, corrupted, mismatched, and ambiguous inputs as well as normal examples.
Recommendation systems and search
Ranking metrics evaluate order, but a production recommender also affects discovery, coverage, and user experience. A system can raise clicks while narrowing the content users see, or perform well for frequent users and poorly for new ones.
Consider:
- Relevance at meaningful cutoffs, such as Recall@K or NDCG@K
- Catalog or result coverage
- Cold-start performance for new users and items
- Diversity and freshness
- Long-term satisfaction, not only immediate clicks
- Position and exposure effects
Offline evaluation is valuable for screening candidates. Controlled online tests can estimate real user outcomes, provided the experiment is designed carefully and safety guardrails are in place.
Robotics, agents, and decision-making policies
For policies that act over time, a prediction score is not the outcome. Evaluate rollouts: repeated attempts across environments, starting states, disturbances, and task variations.
Report:
- Success criteria and rollout count
- Success rate with confidence intervals
- Failure severity and recovery behavior
- Performance under perturbations
- Safety constraints and human intervention frequency
- Differences between simulation and real-world trials
A policy that succeeds in a clean, familiar setup may collapse when objects move, sensors degrade, or an action takes longer than expected. For agent systems that plan and use tools, evaluate the whole chain: tool selection, argument correctness, recovery from errors, and whether the final action served the user’s goal.
🧮 Metrics That Matter: Accuracy, F1, AUC, Calibration, and Beyond
Metrics are compact summaries of behavior, not the behavior itself. Use them to answer a decision question, then inspect the data and examples behind the answer.
| Metric | What it tells you | Watch out for |
|---|---|---|
| Accuracy | Share of all predictions that are correct | Can conceal poor minority-class performance |
| Precision | Share of positive predictions that are correct | May rise while important positives are missed |
| Recall | Share of actual positives detected | May rise at the cost of many false alarms |
| F1 | Balance of precision and recall | Hides the individual trade-off; depends on threshold |
| ROC-AUC | Ranking quality across thresholds | Can look strong with rare positives |
| PR-AUC | Precision-recall behavior across thresholds | Depends on class prevalence |
| MAE | Average absolute prediction error | Treats all error sizes more evenly |
| RMSE | Penalizes larger errors more heavily | Can be dominated by outliers |
| Calibration error | Agreement between confidence and accuracy | Different methods capture different calibration failures |
| NDCG@K | Quality of ranked results near the top | Requires thoughtful relevance judgments |
| Latency | Time to produce a result | Tail latency may matter more than average |
| Cost per successful task | Operational efficiency | Requires defining a “successful task” honestly |
Match metrics to error costs and business outcomes
Begin with the consequences of the model’s errors. In a defect detector, missing a dangerous flaw may be much worse than inspecting a sound item twice. In an email classifier, false positives may hide important messages, while false negatives may add inbox clutter.
Build the metric plan around outcomes:
- Identify the key decision.
- List possible error types.
- Estimate their severity and frequency.
- Choose metrics that expose those errors.
- Set acceptable operating thresholds.
- Confirm with real users or domain experts.
This is where AI evaluation connects directly to business strategy. Our AI business applications coverage explores how to assess tools in the workflow they are meant to improve—not just as isolated model scores.
Use precision, recall, and confusion matrices wisely
Precision and recall describe different sides of a decision:
- High precision means fewer false alarms among flagged cases.
- High recall means fewer missed cases among all relevant cases.
A confusion matrix makes the trade-off visible:
| Actually positive | Actually negative | |
|---|---|---|
| Predicted positive | True positive | False positive |
| Predicted negative | False negative | True negative |
A model with high recall may be the right choice when misses are dangerous and humans can review alerts. A model with high precision may better when false alerts are costly or review capacity is limited. There is no universally “better” balance; the application sets the priority.
Measure latency, reliability, and resource use
Quality scores do not tell you whether a model can serve the product. Measure performance under expected load and on the hardware you will actually use.
Include:
- Median and tail latency, such as p95 or p99
- Throughput under realistic concurrency
- Memory and accelerator requirements
- Failure rate and timeout behavior
- Availability and fallback performance
- Energy or infrastructure requirements when relevant
For deployment teams, AI quality also intersects with AI infrastructure and AI automation workflows. A model that performs beautifully in a notebook but breaks the production pipeline is not a winner. It is an expensive science fair project.
🧰 Test Data, Train-Test Splits, and Cross-Validation
Evaluation quality depends on how examples are separated. A model cannot prove it generalizes if nearly the same people, recordings, or future observations appear on both sides of the split.
Prevent leakage across users, time, and near-duplicate examples
Use the unit that corresponds to independence in the real task:
- Users or patients: Group all records for an individual into one split.
- Video or audio: Keep a recording or session together.
- Locations or devices: Hold out sites or machines when deployment will reach new ones.
- Time-dependent prediction: Train on the past and test on later periods.
- Documents or images: Detect exact and near duplicates across splits.
Preprocessing can leak too. Fit transformations using training data, then apply the learned transformations to validation and test data. If normalization statistics or feature selection have seen the holdout, the test is no longer clean.
Choose random, stratified, group, or time-based splits
| Split strategy | Useful when | Main caution |
|---|---|---|
| Random split | Examples are independent and similarly distributed | Can split related observations across sets |
| Stratified split | You need class proportions maintained | Does not by itself prevent group leakage |
| Group split | Examples share users, devices, sessions, or locations | Group differences can make the estimate noisier |
| Time-based split | Future performance matters | The future may contain drift absent from the test period |
| Cross-validation | Data is limited and repeated estimates help | Requires more training runs and careful grouping |
An 80/20 split can be a quick baseline, not a law of nature. Cross-validation helps estimate variability on small datasets, but use grouped or time-aware folds when observations are related. In scikit-learn, see the documentation for cross-validation strategies, including grouped and stratified approaches.
Handle small datasets and changing data distributions
When data is limited:
- Use repeated or nested cross-validation where appropriate.
- Report uncertainty and avoid overclaiming small differences.
- Keep a truly independent final test set if feasible.
- Collect examples to fill known coverage gaps.
- Consider expert review for ambiguous high-impact cases.
When the distribution changes, an old test set may gradually become less representative. Keep it as a stable regression check, but supplement it with fresh, reviewed production samples. A benchmark can stay useful as history while becoming stale as a forecast.
⚖️ Fairness, Robustness, Safety, and Responsible AI Evaluation
A model ranking that ignores who bears the errors is incomplete. Responsible evaluation asks not only whether the average result is good, but for whom, under what conditions, and with what consequences.
Test subgroup performance and intersectional differences
Where relevant and legally appropriate, evaluate performance across meaningful demographic or operational groups. Examples may include language, age band, skin tone, region, disability-related input conditions, device, or environment.
Avoid two common mistakes:
- Reporting no subgroup results because the data is inconvenient.
- Treating a single fairness metric as a complete fairness verdict.
Different measures can conflict, and a low sample count makes comparisons uncertain. Report group sample sizes, confidence intervals, data limitations, and the concrete decision affected by any observed gap. The NIST AI RMF provides guidance for identifying context-specific risks rather than relying on a universal fairness score.
Probe distribution shifts, adversarial inputs, and edge cases
Robustness evaluation checks whether performance survives plausible changes:
- Background noise, blur, missing fields, or format changes
- Seasonal or geographic shifts
- Unusual but valid user requests
- Out-of-distribution inputs
- Adversarial or misleading content
- Upstream software, sensor, or API changes
Build tests from actual production risks. A random corruption benchmark may be useful, but it is not a substitute for testing the kinds of shifts your users and systems will really generate.
Evaluate privacy, toxicity, hallucinations, and harmful outputs
Generative and predictive systems can create harms not captured by task accuracy. Depending on the application, evaluate:
- Personal or confidential data exposure
- Unsupported factual claims and fabricated citations
- Toxic, discriminatory, or unsafe content
- Prompt injection or tool misuse
- Inappropriate action without human approval
- Overconfident responses when evidence is weak
Use automated checks for scale, but include human review for ambiguous or high-impact cases. Maintain clear escalation and abstention behavior. A good system knows when to stop pretending it knows.
🏆 How to Rank AI Models Without Misleading Yourself
A ranking compresses many measurements into an ordering. That can help a decision—but only if the compression is transparent.
Build a scorecard instead of trusting one leaderboard number
Use a scorecard with separate measures for the dimensions that matter. For example:
| Dimension | Example measure | Decision question |
|---|---|---|
| Task quality | Recall, factuality, task success | Does it do the job? |
| Reliability | Repeatability, failure rate | Does it keep doing the job? |
| Safety and fairness | Risk tests, subgroup gaps | Who may be harmed or underserved? |
| Operations | Latency, availability, throughput | Can we run it in production? |
| Economics | Cost per successful task | Is the outcome sustainable? |
| Human workload | Review time, correction rate | Does it reduce work or relocate it? |
A leaderboard can still be handy for a first look. Just don’t let one number impersonate the full procurement decision.
Weight criteria transparently and test ranking sensitivity
If you combine metrics into a weighted score, write down the weights and rationale. Ask stakeholders whose priorities are represented and whose are missing.
Then conduct a sensitivity check:
- Vary each weight within a reasonable range.
- See whether the top-ranked model changes.
- Identify candidates that remain strong across many plausible weightings.
- Present unstable rankings as trade-offs, not certainty.
If a tiny adjustment makes Model B leap from third to first, your scoring formula is doing more steering than the evidence.
Report confidence intervals, trade-offs, and practical significance
For each candidate, report the estimate, sample size, uncertainty, and operating point. Clarify whether an observed improvement is statistically reliable and whether it changes the real decision.
A useful report might say: “Model A improved recall on the target class, with a modest increase in false alerts; the difference was consistent across three seeds but uncertain for the small rural-site slice.” That sentence tells decision-makers much more than “Model A won.”
🔁 Production Evaluation, Monitoring, and Model Drift
Models meet their real environment after deployment. Inputs evolve, users adapt, vendors update systems, and a retrain can repair one weakness while reopening another.
Monitor data quality, drift, and changing user behavior
Monitor both the data arriving at the model and the consequences of its outputs. Feature drift alone does not prove the model is failing, but it can signal that you should investigate. Likewise, stable input statistics do not prove outcomes remain good.
Useful signals include:
- Missing or malformed input rates
- Feature and embedding distribution changes
- Output and confidence distributions
- User corrections and complaints
- Human escalation and override rates
- Delayed outcome labels, where available
Set thresholds for investigation, not just for paging someone after the damage is done.
Use human review and feedback loops responsibly
Human oversight is most useful when reviewers have clear instructions, suitable expertise, and authority to intervene. Blindly asking people to approve every prediction can produce rubber-stamping, fatigue, and a misleading sense of control.
Build a feedback process that:
- Prioritizes uncertain or high-impact outputs
- Captures reasons for corrections
- Separates user preference from factual error
- Audits human disagreement
- Protects sensitive information
- Feds verified examples into evaluation and training only after review
Human feedback is evidence, not automatically ground truth. Reviewers need guidance, and disagreements may reveal that a task or rubric is underspecified.
Set re-evaluation triggers and rollback criteria
Decide in advance what would trigger a re-evaluation or rollback. Examples include:
- A major data, model, prompt, or infrastructure change
- A meaningful shift input distribution
- Regression on a critical slice
- Increased harmful-output or privacy incidents
- Latency, uptime, or review burden exceeding limits
- New regulations or product requirements
Keep a versioned regression set and repeat it after every significant change. Then evaluate on fresh samples as well; old regression examples catch known failures, while new data can reveal the failures you have not yet named.
🛠️ Tools and Practical Resources for Model Evaluation

Tools can reduce repetitive work, but they cannot decide what “good” means for your users. Choose tooling based on the evaluation workflow: data inspection, experiment tracking, error analysis, or ongoing monitoring.
Open-source evaluation and experiment-tracking tools
| Tool | Useful for | Considerations |
|---|---|---|
| scikit-learn | Metrics, baselines, validation, classic ML workflows | Not a complete production monitoring system |
| MLflow | Tracking experiments, artifacts, and model versions | Requires disciplined experiment naming and metadata |
| Weights & Biases | Experiment tracking, dashboards, collaboration | Check data-sharing and governance requirements |
| Evidently AI | Data and model monitoring reports | Interpret alerts in context; drift is not automatically failure |
| FiftyOne by Voxel51 | Dataset exploration, model evaluation, visual error analysis | Especially useful when examples are images, video, or other inspectable media |
| Huging Face Evaluate | Reusable evaluation methods for machine-learning tasks | Metric choice and dataset suitability remain your responsibility |
Voxel51’s evaluation and scenario-analysis capabilities can help teams explore slice-level behavior and inspect examples behind model results. The tool is most valuable when it supports an explicit evaluation plan—not when it becomes another dashboard to admire while nobody checks the labels.
Dataset versioning, error analysis, and model monitoring
A dependable evaluation stack should let you answer:
- Which exact data version produced this score?
- Which model, prompt, preprocessing, and threshold were used?
- What examples caused the regression?
- Can we reproduce the result?
- Has live traffic shifted from the evaluation data?
- Who reviewed ambiguous or high-risk outputs?
Version datasets and evaluation code alongside models. Keep a regression set for known problems, a fresh sample for current reality, and an audit trail for decisions. Teams covering AI news can follow relevant research and tooling developments, but new benchmark headlines should still be checked against the application’s own evidence.