Support our educational content for free when you purchase through links on our site. Learn more
👁️ AI vs. Human Vision: Who Wins on Accuracy in 2026?


Computer vision models can match or outperform people on specific, carefully defined benchmarks, but humans remain more adaptable when images, contexts, and tasks change. To answer “How do computer vision benchmarks compare to human vision in terms of accuracy and performance?”, you need to look beyond a single accuracy score and compare the same task, images, labels, and conditions.
Here’s the twist: one study reported a strong vision model scoring about 70% on an unrestricted 1,000-class task, then about 92% in a task-specific forced-choice test. Those results weren’t a magic leap in eyesight—the evaluation setup changed. The study is a vivid reminder that benchmark rules can shape who appears to win.
The practical takeaway? Treat benchmark scores as evidence about a particular test, not proof that a model “ses like a human.” We’ll compare 15 major benchmarks, explain the metrics that matter, and show how to judge performance for real-world use.
Key Takeaways
- There is no universal winner: AI can excel at narrow, repeatable visual tasks; people often bring stronger flexibility and context to unfamiliar situations.
- Benchmark design changes the result: Label choices, forced-choice formats, time limits, and image selection can shift human–AI comparisons.
- Accuracy is only one measure: Robustness, recall, latency, calibration, energy use, and the consequences of errors matter too.
- Use multiple benchmarks: ImageNet measures classification, while datasets such as ObjectNet, CO, and Cityscapes test different challenges.
- Validate with real data: A high benchmark score is not a deployment guarantee. Test on your own images and monitor errors over time.
Table of Contents
- ⚡ Quick Tips and Facts
- 🧭 What Does It Mean to Compare Computer Vision With Human Vision?
- Computer vision accuracy, speed, and robustness in plain English
- Human visual perception is more than image recognition
- 📜 How Computer Vision Benchmarks and Human Vision Research Evolved
- From handwritten digits to large-scale image datasets
- Why modern AI benchmarks still differ from everyday vision
- 📏 How to Measure Accuracy and Performance Fairly
- Top-1 accuracy, top-5 accuracy, and error rates
- Precision, recall, F1 score, and mean average precision
- Intersection over Union and segmentation metrics
- Latency, throughput, energy use, and compute cost
- Human baselines, experimental controls, and statistical uncertainty
- 🏆 15 Computer Vision Benchmarks Compared With Human Vision
- 1. ImageNet: large-scale image classification
- 2. CIFAR-10 and CIFAR-100: small-image object recognition
- 3. MNIST: handwritten digit recognition
- 4. ObjectNet: object recognition under unusual viewpoints
- 5. ImageNet-A: naturally difficult images
- 6. ImageNet-C: common image corruptions and robustness
- 7. ImageNet-R: renditions, art, and non-photographic images
- 8. ImageNet-Sketch: recognition from sketches
- 9. CO: object detection and instance segmentation
- 10. PASCAL VOC: object detection and visual classification
- 11. ADE20K: scene parsing and semantic segmentation
- 12. Cityscapes: urban-scene understanding
- 13. KITI: autonomous-driving perception
- 14. MS CO Captions: image understanding and captioning
- 15. Visual Question Answering benchmarks: reasoning about images
- 🤖 Where Computer Vision Matches, Exceeds, or Trails Human Performance
- Narrow, familiar tasks where machines excel
- Object detection, segmentation, and fine-grained recognition
- Out-of-distribution images and unfamiliar situations
- Context, common sense, and visual reasoning
- 🧠 How Human Vision Differs From Computer Vision Models
- Learning from fewer examples and using prior knowledge
- Robustness to noise, oclusion, lighting, and viewpoint
- Attention, perception, memory, and adaptation
- Why humans and models can make different mistakes
- ⚖️ Why Benchmark Scores Can Mislead
- Dataset bias, shortcuts, and image leakage
- Training data contamination and benchmark overfitting
- Annotation quality and disagreement among human raters
- Closed-set labels versus open-world recognition
- Human comparison pitfalls: instructions, time limits, and expertise
- 🛡️ Robustness, Safety, and Fairness in Visual AI
- Adversarial examples and distribution shifts
- Bias across demographics, environments, and image quality
- Uncertainty estimation and knowing when a model is unsure
- Privacy, surveillance, and responsible deployment
- 🔬 How to Design a Fair Human-versus-AI Vision Test
- Choose a task and dataset that reflect real use
- Match the images, instructions, and evaluation conditions
- Report confidence intervals, subgroup scores, and failure cases
- Separate accuracy from speed, cost, and energy
- 🏥 Real-World Applications: When Human or Machine Vision Is Better
- Medical imaging and clinical decision support
- Autonomous vehicles and road-scene perception
- Manufacturing inspection and quality control
- Accessibility, retail, agriculture, and wildlife monitoring
- Human-in-the-loop systems and effective collaboration
- 🔮 What’s Next for Computer Vision Benchmarks
- Real-world, dynamic, and video-based evaluation
- Multimodal vision-language benchmarks
- Continual learning, data efficiency, and generalization
- More transparent, reproducible, and human-centered testing
- ❓ Frequently Asked Questions
- Are computer vision systems more accurate than humans?
- What is a human baseline in computer vision?
- Which computer vision benchmark is closest to real-world performance?
- Can an AI outperform humans on a benchmark but fail in practice?
- How should I compare model accuracy with human accuracy?
- Does higher accuracy always mean a better vision system?
- ✅ Quick Tips for Reading Computer Vision Benchmark Results
- Conclusion
- Recommended Links
- Reference Links
⚡ Quick Tips and Facts
The short answer: Computer vision can equal or beat people on specific, well-defined tests. That does not mean it sees or understands the world as people do. A fair comparison matches the task, images, labels, timing, and information available to both.
In our work as AI researchers and machine-learning engineers at ChatBench.org™, we treat benchmark scores as evidence about a particular test, not a universal score for “vision.” Our computer vision benchmarks guide explains how benchmark choice can change the apparent winner.
| What you’re comparing | What the result can tell you | What it cannot prove by itself |
|---|---|---|
| Classification accuracy | How often a model or person selects the correct label on that dataset | That the system understands unfamiliar scenes |
| Human-versus-model score | Relative performance under the stated test conditions | That the comparison was fair if tasks or time limits differed |
| Robustness score | How performance changes with corruption, viewpoint, or other variation | How the system will perform in every deployment environment |
| Latency and throughput | How quickly the system processes inputs | Whether its answers are accurate, safe, or useful |
| Agreement with people | Whether a model tends to make similar decisions | That it uses human-like visual reasoning |
Quick facts worth keeping in view
- ImageNet results and real-world results are different questions. ImageNet measures classification over a defined set of categories; it does not test every aspect of visual perception. See the ImageNet project and the original ImageNet paper.
- Test conditions can swing results dramatically. One recent human–model study reported that a strong model’s score was about 70% in an unrestricted 1,000-class task but about 92% in a task-specific forced-choice test. The test was not measuring exactly the same challenge in both cases. Read the study.
- Humans often generalize better to unusual views and contexts. On ObjectNet, models face objects photographed from varied angles and in unfamiliar settings. The benchmark’s authors designed it to expose weaknesses hidden by familiar image distributions.
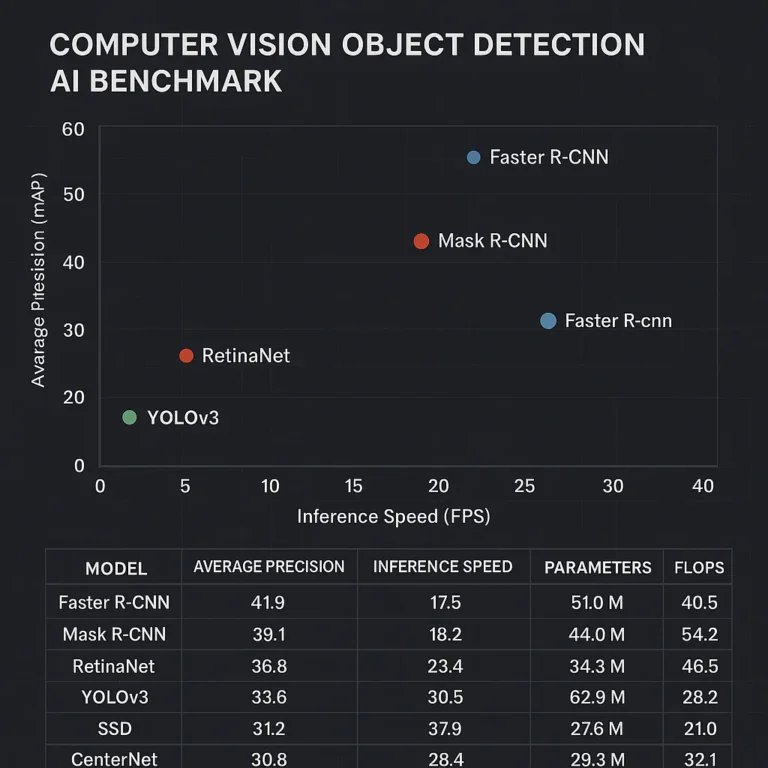
- “Accuracy” is not one universal metric. Image classification, object detection, segmentation, and medical-image triage use different measures. A 90% classification accuracy cannot be directly compared with 60 mean average precision in detection.
- A high average can hide a weak slice. A system may do well in daylight and poorly at night, or perform strongly on common objects but badly on rare ones. Always inspect class-level and condition-level results.
- The practical winner depends on the job. A tireless camera-inspection system may be excellent for repetitive checks; people remain valuable for ambiguous cases, unexpected objects, and decisions requiring context. That balance also appears in our coverage of AI business applications.
✅ Trust a benchmark more when its test set resembles the real use case, its human baseline is well controlled, and its errors are reported—not just its headline score.
❌ Be wary when a claim says “better than humans” without naming the task, dataset, evaluation metric, or test conditions.
🧭 What Does It Mean to Compare Computer Vision With Human Vision?
Comparing a computer vision model with a person sounds straightforward: show both an image and see who gets it right. The catch is that “gets it right” can mean several different things.
A model might classify a cropped object from a fixed list in milliseconds. A person might see the entire scene, recognize an object despite an unfamiliar angle, infer what is happening, and explain their uncertainty. Those are related abilities, but they are not the same test.
Computer vision accuracy, speed, and robustness in plain English
Computer vision is a broad field that enables computers to analyze images and video. A system may be trained to:
- Classify an image, such as identifying a bird species.
- Detect objects and locate them with bounding boxes.
- Segment an image into object-level or pixel-level regions.
- Track objects across video frames.
- Estimate depth, pose, motion, or other visual properties.
- Answer questions about an image or generate a caption.
The Stanford CS231n course materials provide a useful introduction to these core tasks and the deep-learning methods behind them.
A comparison should specify at least four things:
- The task: Is the system naming one object, finding every object, or interpreting a scene?
- The permitted answers: Is it choosing from 10 labels, 1,000 labels, or an open-ended set?
- The conditions: Are images clean and familiar, or are they blurry, ocluded, or taken from unusual viewpoints?
- The score: Is success measured by accuracy, recall, overlap, response time, or a combination?
The distinction matters. In a forced-choice task, participants select from a fixed list; in free response, they must produce answer without seeing the options. A forced-choice test can make classification easier because the candidate labels narrow the possibilities.
Accuracy is one part of performance
For a deployed system, “performance” can include:
- Correctness: Does it identify the right thing?
- Coverage: Does it work for the variety of inputs the application encounters?
- Speed: How long does inference take?
- Consistency: Does it behave similarly across repeated or slightly changed inputs?
- Robustness: Does it hold up to lighting, viewpoint, weather, motion blur, or oclusion?
- Operational fit: Can it run reliably on the available hardware and within the workflow?
A factory system that is 98% accurate but stops the production line every few minutes may be less useful than a slightly less accurate system that reliably flags uncertain cases for inspection. The best choice depends on the cost of a false alarm and a missed defect.
Human visual perception is more than image recognition
Human vision is not simply a biological version of an image classifier. People combine sight with attention, memory, prior knowledge, language, and experience. We can often identify an object from a partial glimpse, use surrounding context to resolve ambiguity, or notice that something about a scene “doesn’t look right.”
That does not make people infallible. Humans can miss details, disagree, suffer fatigue, and be influenced by expectations. Their visual judgments vary with task, experience, viewing conditions, and the time they have to respond.
The useful comparison is therefore not “Which has better vision?” but “Which performs better on this task, under these constraints, and with what failure modes?”
📜 How Computer Vision Benchmarks and Human Vision Research Evolved
Computer vision benchmarks began as a way to compare algorithms on shared data. Over time, datasets grew, models improved, and benchmark scores became a convenient shorthand for progress. That shorthand is useful—but it can encourage a misleading leap from “this model won this test” to “this model sees like a person.”
From handwritten digits to large-scale image datasets
Early benchmark tasks often involved narrow visual problems, such as recognizing handwritten digits. MNIST, introduced by Yann LeCun and colleagues, became a foundational dataset for testing classification methods. Its simple grayscale images made it valuable for research and education, but success on digits says little about understanding complex natural scenes. MNIST dataset
Later, datasets such as ImageNet provided far more categories and images. The ImageNet Large Scale Visual Recognition Challenge helped popularize large-scale image classification and accelerated the adoption of deep convolutional neural networks. The 2012 AlexNet result is often cited as a landmark in that shift. AlexNet paper
As models became stronger on standard test sets, researchers built benchmarks to probe what those scores left out: unfamiliar viewpoints, distribution shifts, natural image corruptions, sketches, artistic renditions, and adversarial changes. Examples include ObjectNet, ImageNet-C, and WILDS.
Why modern AI benchmarks still differ from everyday vision
A benchmark must be controlled enough to evaluate models consistently. Real environments are messy: they change over time, contain rare events, and may not have one obvious correct label. Those realities make benchmarks valuable but incomplete.
A recent study comparing people with CNNs, vision transformers, and the multimodal model CoCa illustrates how test design changes the apparent result. In one shared 10-way forced-choice task, humans achieved 92% accuracy at 200 milliseconds. In another test using models’ original 1,000-class outputs and free-response answers from people, humans scored 96% on isolated objects, while CoCa scored 75%. When models were fine-tuned for a smaller forced-choice task, CoCa and ViT-B8 exceeded the reported human average. Study details
Those results are not necessarily contradictory. The tasks differ in label space, response format, and model adaptation. The authors’ central caution is that models can match or surpass people under conditions optimized for the specific machine task, yet still struggle with generalization to difficult categories and real-world variation.
We see the same lesson when teams choose evaluation data for business systems: the score is only meaningful if the test resembles the work. For guidance on turning evaluations into operational decisions, explore our AI automation workflows and AI infrastructure coverage.
📏 How to Measure Accuracy and Performance Fairly
The first step in a human–AI comparison is to choose a metric that matches the task. The second is to resist comparing numbers that look similar but measure different things.
Top-1 accuracy, top-5 accuracy, and error rates
For top-1 accuracy, a prediction is correct if the model’s highest-ranked label matches the ground truth. For top-5 accuracy, it counts as correct if the right label appears anywhere among the model’s five highest-ranked choices.
If a model classifies 900 of 1,000 images correctly at top-1, its top-1 accuracy is 90%. Its error rate is 10%. Top-5 accuracy will usually be higher because it gives the model four additional chances to include the correct answer.
That can be useful when the system is a decision aid, but it is not equivalent to a person naming the correct object without a shortlist. Always check which score is being reported.
| Metric | Basic question | Common use | Watch out for |
|---|---|---|---|
| Top-1 accuracy | Was the first prediction correct? | Image classification | Hides class imbalance and error severity |
| Top-5 accuracy | Was the correct label among five predictions? | Large-label classification | More forgiving than a single-answer human response |
| Error rate | What fraction of predictions were wrong? | Classification | Does not show which errors matter most |
| Balanced accuracy | How well does the model perform across classes? | Imbalanced datasets | Still depends on reliable class labels |
| Calibration | Do confidence scores match actual correctness? | Triage and decision support | A confident wrong answer can be dangerous |
Precision, recall, F1 score, and mean average precision
In object detection and screening tasks, one kind of error may be more consequential than another.
- Precision asks: Of the cases the system flagged, how many were correct?
- Recall asks: Of all true cases, how many did it find?
- F1 score combines precision and recall into a single measure.
- Mean average precision (mAP) summarizes detection performance across classes and confidence thresholds, typically incorporating the quality of object localization.
For example, a medical screening model might need high recall so it misses fewer possible cases, while a manufacturing system may prioritize precision to avoid costly false alarms. Neither metric is “best” in isolation; the right choice depends on the consequences of each error.
The scikit-learn metric guide explains common classification metrics, while the CO evaluation toolkit documents detection metrics used by a major benchmark.
Intersection over Union and segmentation metrics
For object detection and segmentation, recognizing the right class is not enough; the model must also locate the object.
Intersection over Union (IoU) compares a predicted region with the ground-truth region:
[
\text{IoU} = \frac{\text{area of overlap}}{\text{area of union}}
]
An IoU of 1 means the regions match perfectly; 0 means they do not overlap. Detection benchmarks often count a predicted box as correct only when its IoU exceeds a threshold. Segmentation systems may report mean IoU across classes.
| Task | Example output | Common evaluation |
|---|---|---|
| Classification | “This is a golden retriever” | Top-1 accuracy |
| Object detection | Label plus bounding box | mAP at one or more IoU thresholds |
| Semantic segmentation | A class for each pixel | Mean IoU |
| Instance segmentation | Separate masks for each object | Mask AP or IoU-based scores |
| Image captioning | A sentence describing the image | Automated text metrics plus human evaluation |
A classification model can be excellent and still be unsuitable for detection: “There’s a bicycle” does not tell a robot where the bicycle is.
Latency, throughput, energy use, and compute cost
Speed is not a footnote when systems run in real time. Latency is the time to produce a result; throughput is how many inputs a system processes in a given period. A model may have low latency for one image but limited throughput when a large camera feed is involved.
Other practical measures include:
- Hardware requirements and memory use.
- Energy consumption per inference or per hour.
- Availability and failure rate.
- Time required for setup, maintenance, and human review.
- How quickly the system responds to uncertain or unusual inputs.
In our deployment reviews, we ask teams to measure the complete pipeline, not only the neural network. Image capture, pre-processing, network transfer, and human escalation can change the overall response time. For more on production requirements, see AI infrastructure.
Human baselines, experimental controls, and statistical uncertainty
A human baseline is meaningful only when people and models face comparable conditions. A careful study should report:
- Whether people saw the same images as the model.
- Whether both received the same labels or answer choices.
- Whether viewing time was matched or deliberately varied.
- Whether people answered freely or selected from a menu.
- How many participants took part and what experience they had.
- How scores vary between people, not only the group average.
- Confidence intervals or other measures of statistical uncertainty.
A percentage difference can look decisive while being too small to distinguish from random variation. Studies should explain the statistical test used and avoid treating a tiny numerical lead as a meaningful victory.
A recent study found human test–retest accuracy around 85–86% in one task, with median within-person agreement of κ = 0.85. That indicates substantial consistency, but it also shows why individual and group-level variation should be reported. Study
🏆 15 Computer Vision Benchmarks Compared With Human Vision
No single benchmark captures visual intelligence. The following set spans classification, detection, segmentation, scene understanding, and image-language tasks. Together, they offer a more useful picture than a single leaderboard score.
| # | Benchmark | Primary task | What it helps reveal |
|---|---|---|---|
| 1 | ImageNet | Image classification | Performance on a large, fixed label set |
| 2 | CIFAR-10 / CIFAR-100 | Small-image classification | Recognition in compact low-resolution images |
| 3 | MNIST | Digit classification | A simple, highly controlled recognition task |
| 4 | ObjectNet | Object classification | Viewpoint and background robustness |
| 5 | ImageNet-A | Classification | Performance on naturally difficult images |
| 6 | ImageNet-C | Coruption robustness | Sensitivity to common image distortions |
| 7 | ImageNet-R | Classification | Generalization to artistic and other renditions |
| 8 | ImageNet-Sketch | Sketch recognition | Recognition without ordinary photographic texture |
| 9 | CO | Detection, segmentation, captioning | Everyday objects and multi-task evaluation |
| 10 | PASCAL VOC | Classification and detection | A classic object-recognition benchmark |
| 11 | ADE20K | Scene parsing | Dense labeling of complex scenes |
| 12 | Cityscapes | Urban-scene segmentation | Road-scene perception under real driving conditions |
| 13 | KITI | Autonomous-driving perception | Detection, tracking, depth, and road scenes |
| 14 | MS CO Captions | Image captioning | Connecting visual content with language |
| 15 | Visual Question Answering | Image reasoning | Answering natural-language questions about images |
1. ImageNet: large-scale image classification
ImageNet became a defining image-classification benchmark, with the ImageNet Large Scale Visual Recognition Challenge using a 1,000-class subset. It is helpful for comparing classifiers under a shared protocol, and its scale helped drive major progress in deep learning.
Strengths: large-scale evaluation, broad object categories, extensive historical comparisons.
Limitations: a closed label set and curated images do not represent every viewpoint or deployment condition.
Human-versus-model comparisons can also depend on whether the human task uses the same 1,000 labels, a smaller forced-choice set, or free response. That difference is one reason “human-level ImageNet accuracy” requires careful interpretation.
2. CIFAR-10 and CIFAR-100: small-image object recognition
CIFAR-10 and CIFAR-100 contain small color images across 10 and 100 classes. They remain popular for teaching and controlled model comparisons.
Strengths: lightweight, accessible, and useful for testing methods quickly.
Limitations: low resolution and a relatively limited visual world make them poor stand-ins for many real applications.
A person may easily identify an object in the real world but struggle with a tiny, compressed crop. The benchmark measures what is visible in that representation—not the full capacity of human vision.
3. MNIST: handwritten digit recognition
MNIST is a classic dataset of handwritten digits. It is a strong teaching benchmark for classification pipelines and remains a useful baseline for introductory work.
Strengths: simple, fast, and easy to reproduce.
Limitations: modern models solve it so reliably that it rarely distinguishes advanced visual capabilities. It does not test everyday object recognition.
Think of MNIST as a ruler, not a driving test: useful for measuring one basic capability, not for proving general competence.
4. ObjectNet: object recognition under unusual viewpoints
ObjectNet was designed to challenge models with objects photographed in varied orientations, backgrounds, and settings. Its published dataset includes 50,000 images across 313 categories, with a subset overlapping ImageNet categories.
A human–model study reports that model accuracy can drop sharply from ImageNet to ObjectNet, and that removing backgrounds using human-drawn boxes can improve some model scores. Study discussing ObjectNet performance
Why it matters: a model trained on familiar object orientations may exploit visual patterns that do not survive a new viewpoint. People often use shape and object knowledge more flexibly, though they are not immune to ambiguity.
5. ImageNet-A: naturally difficult images
ImageNet-A contains naturally occurring images that many ImageNet-trained models find difficult. Unlike synthetic corruptions, its challenge comes from images selected to expose vulnerabilities in ordinary classifiers.
Strengths: tests failures on real images without changing the model’s basic classification task.
Limitations: performance depends on the benchmark’s selected classes and examples; it should be one stress test among several.
A strong ImageNet-A result is evidence of improved robustness to that dataset’s challenges—not a guarantee against every unexpected scene.
6. ImageNet-C: common image corruptions and robustness
ImageNet-C evaluates classification under common corruptions such as noise, blur, weather effects, and digital distortions.
It helps answer: Does performance degrade gracefully when image quality changes? That is relevant for cameras exposed to motion blur, low light, rain, compression, or sensor noise.
Strengths: controlled corruption types and severity levels make comparisons informative.
Limitations: synthetic corruptions cannot reproduce every real shift, such as a new camera, a different population, or a changed workflow.
7. ImageNet-R: renditions, art, and non-photographic images
ImageNet-R includes renditions such as paintings, cartoons, embroidery, and sculptures from overlapping ImageNet classes.
Why it matters: an object may remain recognizable even when its texture, color, and photographic appearance change. This can reveal whether a model relies too heavily on familiar surface cues.
A model that performs well on photos but poorly on drawings may still be useful for a photo-only workflow. It is simply not evidence of flexible recognition across visual styles.
8. ImageNet-Sketch: recognition from sketches
ImageNet-Sketch tests classification on sketch representations of ImageNet categories. It removes many pixel-level cues and emphasizes contour and shape.
Strengths: a direct challenge to texture-dependent recognition.
Limitations: sketches are a specific visual domain, not a complete measure of human-like shape understanding.
This benchmark is especially revealing when a system claims broad object recognition. If it only succeeds when the object’s photographic texture is present, that is a useful limitation to know.
9. CO: object detection and instance segmentation
The CO dataset is widely used for object detection, segmentation, and image captioning. It contains complex everyday scenes with multiple objects and annotations.
Strengths: tests localization and multi-object recognition, not just one label per image.
Limitations: its metric, such as mAP, is not directly comparable to human top-1 accuracy.
Humans can often point out objects that are small, overlapping, or partly obscured, but a direct comparison must define exactly how a person’s answer becomes a box or mask. That annotation task can be surprisingly demanding.
10. PASCAL VOC: object detection and visual classification
PASCAL VOC helped establish standard protocols for object classification, detection, and segmentation.
Strengths: historically important; useful for understanding progress in object-recognition methods.
Limitations: smaller and more limited in category coverage than newer benchmarks.
It remains useful when comparing with earlier literature, but modern deployment decisions should include more recent and domain-specific tests.
11. ADE20K: scene parsing and semantic segmentation
ADE20K is a scene-understanding dataset with dense semantic labels. A model must classify many regions or pixels, such as walls, furniture, roads, vegetation, or objects.
Why it matters: recognizing a single object is not the same as parsing a whole scene. ADE20K evaluates a more detailed visual output.
Caution: pixel labels can be subjective at boundaries or for ambiguous regions. Annotation conventions influence the score.
12. Cityscapes: urban-scene understanding
Cityscapes focuses on pixel-level understanding of urban street scenes. It is relevant to autonomous driving and other systems that must distinguish roads, vehicles, pedestrians, signs, and buildings.
Strengths: detailed, real-world urban imagery and segmentation labels.
Limitations: particular cities, weather, camera setups, and annotation choices do not represent every road environment.
For safety-related applications, a good Cityscapes score should be supplemented with tests across different weather, regions, cameras, and rare hazards.
13. KITI: autonomous-driving perception
The KITI Vision Benchmark Suite includes tasks such as object detection, tracking, depth estimation, and road-scene understanding.
It is an important research reference, but autonomous driving involves more than benchmark perception: temporal reasoning, sensor fusion, planning, uncertainty handling, and safety validation all matter.
A system that identifies a pedestrian in a still image must also track movement and respond appropriately in time. That is a different operational challenge.
14. MS CO Captions: image understanding and captioning
CO includes image-caption annotations that support research on describing visual content in language. Caption quality is difficult to reduce to one number because different descriptions can be correct.
Automated text metrics can compare words with reference captions, but a fluent sentence may still omit a key detail or invent something not present. Human evaluation and factuality checks are therefore especially important. CO captions and tasks
15. Visual Question Answering benchmarks: reasoning about images
Visual Question Answering (VQA) tests whether a system can answer natural-language questions about an image. The VQA dataset and research project helped popularize this task.
A system might be asked, “What color is the bus?” or “How many people are visible?” Correct answers can require recognition, counting, relational understanding, and language processing.
Strengths: broader than fixed-label classification.
Limitations: some questions can be answered through dataset patterns rather than genuine visual reasoning, so balanced question design and bias analysis matter.
🤖 Where Computer Vision Matches, Exceeds, or Trails Human Performance
There is no universal scoreboard with “human” one side and “AI” on the other. Performance depends on the visual task, dataset, and operating constraints.
Narrow, familiar tasks where machines excel
Computer vision can be extremely effective when:
- The task is repeated frequently.
- Input capture is consistent.
- The categories are known in advance.
- Training examples cover likely variation.
- A fast and consistent answer is valuable.
Examples include reading specific document fields, sorting familiar product types, detecting a known defect, or flaging a defined visual pattern. Industrial systems can be valuable because they apply the same criteria continuously and can inspect every item, rather than sampling a portion.
But claims such as “99% accuracy” need context. Was the dataset balanced? Were false negatives and false positives counted equally? Did the test set include new production lines or only images from the training environment? Without these details, the number is a polished label on an unknown box.
Object detection, segmentation, and fine-grained recognition
In object detection, systems can process large volumes of images consistently and return structured outputs such as labels and bounding boxes. On established datasets, modern models can reach strong scores—though those scores depend on the benchmark’s categories and annotation rules.
Fine-grained classification can be harder. Distinguishing similar species, parts, or product defects may depend on tiny visual details and expert knowledge. A model can outperform a non-expert person yet still lag a trained specialist.
A helpful comparison should include domain-matched human experts, not just an average participant, when the real question is whether a system can support or replace specialist work.
Out-of-distribution images and unfamiliar situations
Performance often falls when the test images differ from the training distribution. A different camera, background, viewpoint, population, or lighting condition can alter the input in ways the model did not learn to handle.
In a study examining several model families, CoCa and vision transformers generally tracked human performance more closely than traditional CNNs on the tested tasks, while humans often performed better on difficult object categories such as plates, vases, and baskets. The authors also report that humans and models can misclassify the same image in different ways. Full study
That last point matters. If a model and a person each achieve 90% accuracy, they may not be making the same mistakes. A system that disagrees with people can still be useful—but you need to know where and why.
Context, common sense, and visual reasoning
People use surrounding context to identify ambiguous objects. A model may also use context, but it can over-rely on it. If a dataset often shows boats on water, a model may treat water as a shortcut for “boat.” When the boat appears indoors or on a trailer, that association can fail.
A recent comparison found that humans and models both performed better on isolated objects than on full scenes for some conditions, with incongruent backgrounds influencing recognition. This reminds us that “context helps” is not always true: the wrong context can mislead both people and models, but the mechanisms and failure patterns may differ. Study
The first YouTube video frames the strongest practical opportunity as collaboration: machines can process visual information quickly and consistently, while people bring context, experience, and judgment. That is a useful vision, provided the human remains able to challenge the system rather than merely rubber-stamp its output.
🧠 How Human Vision Differs From Computer Vision Models
Learning from fewer examples and using prior knowledge
People often recognize a new object after seeing only a few examples. Machine-learning models typically depend on large datasets, pretraining, fine-tuning, or carefully designed prompts. Modern foundation models can reduce the amount of task-specific training needed, but they still inherit the strengths and gaps of their data and training objectives.
Humans also bring broad prior knowledge. We know that cups can appear in kitchens, offices, or camping scenes, and that they may be partly hidden. A model may learn these relations from images and text, but it can remain brittle when a combination is rare.
This difference is not absolute. People can be poor at unfamiliar technical categories, and a model trained on a specialized dataset may beat non-experts. Expertise is part of the comparison.
Robustness to noise, oclusion, lighting, and viewpoint
People are often resilient to ordinary visual variation. We can recognize an object when it is rotated, partly covered, or seen under changing light, especially if we know what to look for. Models can also be robust, but their performance depends on training exposure and architecture.
The benchmark study’s results on challenging categories and unusual scenes suggest that viewpoint variation and background context can expose weaknesses. Its authors discuss the possibility that some models rely more on local texture cues, while humans benefit from more object-centered shape representations. Study
That is a plausible interpretation, not a universal rule that every model is texture-based or every human is shape-based. Different architectures and training regimes can behave differently.
Attention, perception, memory, and adaptation
People do not inspect every pixel equally. Attention directs our gaze and mental effort toward relevant regions, and we can revise our interpretation as new evidence appears. A computer vision pipeline may process the full image in one pass, use attention mechanisms, or combine multiple frames—but its adaptation is usually constrained by the system’s design.
Humans can also learn during a task: after discovering that a particular object is a new tool, we can apply that knowledge to another angle. Standard benchmark protocols often freeze the model and prohibit updates, so they test fixed-system performance rather than learning-on-the-job.
When evaluating a system that will encounter new products or environments, test whether it can be updated safely and efficiently. That question connects to broader work in AI research and news and AI agents, where systems may need to act on visual input over time.
Why humans and models can make different mistakes
Two observers can have the same accuracy and still differ substantially in reliability. One may confuse similar species; another may miss objects in clutter. A model may rely on a background cue, while a person uses object shape.
The human–model study found that even when both misclassified the same image, their incorrect responses often differed. It also found higher agreement between humans and some transformer or multimodal models than between humans and the tested CNNs—but agreement does not establish identical reasoning. Study
For a business, error overlap is practical:
- Low overlap may make human review useful because a person catches different mistakes.
- High overlap may mean both systems share the same blind spot.
- Different confidence patterns can help direct review effort toward cases where the model is uncertain or the human disagrees.
⚖️ Why Benchmark Scores Can Mislead
A benchmark score is a measurement made under a protocol. It becomes misleading when people treat it as a guarantee of performance outside that protocol.
Dataset bias, shortcuts, and image leakage
A dataset can contain patterns that make the task easier than intended. For instance, a background may correlate with a label, or a particular image source may identify a class. Models can exploit these shortcuts without learning the intended visual concept.
Data leakage occurs when test information unintentionally enters training or model selection. Near-duplicate images, shared source videos, or repeated subjects can make test results look better than true generalization.
Useful checks include:
- Inspecting examples and labels, not just aggregate scores.
- Checking for duplicates or near-duplicates across splits.
- Testing on data collected independently from the training source.
- Evaluating whether backgrounds or metadata predict labels.
- Reporting performance by class and capture condition.
Training data contamination and benchmark overfitting
Public benchmarks are valuable partly because many researchers can use them. But as a benchmark becomes widely used, repeated optimization can turn it into a de facto training target. A model may perform well because its developers have tuned repeatedly to the benchmark’s quirks.
This does not make benchmark results useless. It means a strong claim should be tested against fresh, private, or independently collected data before deployment. Keep a final holdout set that is not used during model selection.
Annotation quality and disagreement among human raters
Ground-truth labels are not always objective. A blurry image may support more than one label; two annotators may disagree about an object’s boundary or even its identity. For images with several plausible descriptions, a single “correct” label can unfairly penalize reasonable answers.
A sound evaluation should document annotation instructions, report disagreement where relevant, and use expert adjudication for high-stakes or ambiguous cases. For segmentation, the exact boundary policy can change IoU scores. For medical images, diagnosis may require clinical context unavailable in a cropped image.
Closed-set labels versus open-world recognition
A closed-set classifier must choose among a known list. An open-world system must also recognize when an image belongs to a class it has never seen—or when it cannot tell.
That distinction changes the safety question:
- Closed-set: “Which of these known categories is this?”
- Open-world: “Is this one of the known categories, something else, or too uncertain to decide?”
A system that confidently assigns every unfamiliar image to the nearest known class may look decisive while being dangerously wrong. Open-set recognition and uncertainty estimation are therefore critical for real deployments.
Human comparison pitfalls: instructions, time limits, and expertise
Human results can be distorted by inconsistent test conditions:
- People may see labels that the model never receives, or vice versa.
- Human responses may be self-paced while model outputs are evaluated under a fixed rule.
- A forced-choice format may inflate performance relative to free naming.
- Participants may be non-experts even when the application requires expert judgment.
- Group averages can conceal wide differences between individual observers.
The recent human–model study demonstrates the effect of setup: the best model’s result differed substantially between a task-specific forced-choice test and an unrestricted 1,000-class test. The fairest interpretation is not that one result “wins,” but that the task definition changed. Study
🛡️ Robustness, Safety, and Fairness in Visual AI
Adversarial examples and distribution shifts
An adversarial example is an input designed or modified to cause a model to make an error. Distribution shift is broader: the data encountered in deployment differ from the training data, whether or not anyone intended to fool the system.
In practice, the most common threats may be less theatrical than a deliberately altered sign. A camera gets replaced, a supplier changes packaging, seasonal light shifts, or a new product variant arrives. Those ordinary changes can still create a meaningful performance gap.
Robustness testing should include:
- Common corruptions such as blur, noise, low light, and compression.
- Natural distribution shifts such as new sites or camera models.
- Oclusion and unusual viewpoints.
- Rare but high-consequence events.
- Attempts to manipulate model input where relevant.
The NIST AI Risk Management Framework offers a broader structure for managing AI risk, including evaluation, monitoring, and governance.
Bias across demographics, environments, and image quality
A model can perform differently across groups or conditions if its data do not represent those groups equally. In vision, relevant slices may include skin tone, age, disability-related aids, clothing, lighting, geography, camera quality, and environmental context.
A fair evaluation should ask:
- Which groups and conditions matter for the application?
- Does the dataset contain enough examples of each?
- Are error rates similar across those slices?
- Do differences have practical consequences?
- Are affected people involved in review and governance?
Do not assume that one overall accuracy score establishes fairness. A system can be accurate on average while failing disproportionately for a group that appears less often in the test set.
Uncertainty estimation and knowing when a model is unsure
A safe system should sometimes say, “I don’t know.” Confidence estimates can help route uncertain cases to a person, trigger another sensor, or request a better image.
However, a confidence score is not automatically a trustworthy probability. Models can be confidently wrong, especially under distribution shift. Calibration tests, selective prediction, and explicit out-of-distribution checks can help, but each should be evaluated in the intended environment.
A practical escalation policy might look like this:
- The model predicts a label and confidence.
- Inputs below a validated confidence threshold go to human review.
- The reviewer can correct the result and record the reason.
- New failure patterns are assessed before retraining.
- The updated system is tested against a frozen holdout set.
Privacy, surveillance, and responsible deployment
Visual systems may process faces, vehicles, homes, workplaces, or sensitive medical images. Before deploying one, establish what is collected, why it is needed, how long it is stored, who can access it, and whether people can contest decisions.
Responsible use includes:
- Data minimization and access controls.
- Clear notice and appropriate consent where required.
- Security review and retention limits.
- Human oversight for consequential decisions.
- Audit logs and documented model updates.
- Evaluation for disparate impact and misuse risks.
The NIST Privacy Framework can help organizations structure privacy risk management. For broader governance and implementation insights, see our AI business applications coverage.
🔬 How to Design a Fair Human-versus-AI Vision Test
A useful comparison does not need to be complicated. It does need to be explicit and reproducible.
Choose a task and dataset that reflect real use
Start with the decision the system will make, not the benchmark that happens to have the most famous leaderboard.
Write down:
- The input: still image, video, scan, or live camera feed.
- The output: label, detection, segmentation, ranking, or recommendation.
- The operating environment: devices, lighting, sites, and users.
- The error costs: what happens after a false positive or false negative?
- The intended human role: operator, expert reviewer, or final decision-maker?
Then select a benchmark or assemble a representative test set. Public datasets help compare methods, while domain-specific data determine whether the system is fit for purpose.
Match the images, instructions, and evaluation conditions
Use the same image set for humans and models wherever possible. Define a common task and make the answer format transparent.
Step by step:
- Create a locked test set. Keep it separate from training and model tuning.
- Define acceptable answers. Decide how synonyms, ambiguous classes, and missing labels will be handled.
- Set human instructions. State whether participants can zoom, revisit images, or choose “unsure.”
- Set model conditions. Specify input resizing, prompts, fine-tuning, test-time augmentation, and allowed context.
- Run the evaluation consistently. Record all exclusions and failures.
- Repeat when appropriate. Test stability across random seeds, participants, or sessions.
If the system will be used with full scenes, do not benchmark only cropped objects. If users get a confidence display, evaluate how that changes their decisions.
Report confidence intervals, subgroup scores, and failure cases
A trustworthy report should include more than one headline figure:
- Overall performance and class-level metrics.
- Confidence intervals or statistical comparisons.
- Performance by lighting, viewpoint, object size, and other relevant slices.
- False-positive and false-negative examples.
- Human participant variation and expertise.
- Error overlap between people and models.
- Results on a separate, out-of-distribution test set.
We also recommend a failure gallery: a curated set of representative errors with enough context to diagnose them. A dozen revealing failures can teach a team more than another decimal place on a leaderboard.
Separate accuracy from speed, cost, and energy
Measure the system as it will actually run:
- On the target hardware, not only a research server.
- With the real image resolution and camera rate.
- Including pre-processing, networking, and review time.
- Under realistic peak load and failure conditions.
- With energy and maintenance needs where relevant.
A system that is technically accurate but too slow for the workflow is not a successful deployment. Neither is a fast system that cannot identify when it is outside its competence.
🏥 Real-World Applications: When Human or Machine Vision Is Better
Medical imaging and clinical decision support
Medical-imaging AI can help highlight regions of interest, prioritize cases, or support specific diagnostic tasks. Its usefulness depends on validation across the patient populations, scanners, institutions, and workflows where it will be used.
Clinical decision support should not be treated as a simple benchmark contest. A study may show strong performance on a curated image set while leaving open questions about workflow effects, rare diseases, patient outcomes, and responsibility for final decisions.
The U.S. Food and Drug Administration’s AI/ML-enabled medical device resources explain regulatory considerations for software-based medical devices. In clinical settings, local validation and specialist oversight remain essential.
Autonomous vehicles and road-scene perception
Driving systems must interpret video streams, track moving objects, predict behavior, and operate under weather and lighting conditions that change from moment to moment. A still-image benchmark is useful but cannot measure the complete driving task.
Robust evaluation should cover:
- Night, rain, glare, and low visibility.
- Rare objects and unexpected road users.
- Construction zones and unusual traffic arrangements.
- Sensor failures and disagreement between sensors.
- Response timing and safe fallback behavior.
The NHTSA automated vehicle resources provide information about safety considerations and automated driving systems.
Manufacturing inspection and quality control
Machine vision is often a strong fit for repetitive inspection when the product, camera, and defect types are reasonably consistent. It can inspect continuously, apply the same criteria repeatedly, and flag subtle patterns for human review.
Benefits:
- Consistent inspection across shifts.
- Fast processing at production speed.
- Reliable recording and traceability.
- Useful coverage for repetitive visual checks.
Drawbacks:
- New product variants can shift the data distribution.
- Defects may be rare or poorly represented in training data.
- Camera or lighting changes can affect results.
- A high false-alarm rate can overwhelm reviewers.
The best deployment often combines controlled imaging with periodic human audits and a process for investigating new defects.
Accessibility, retail, agriculture, and wildlife monitoring
Computer vision can support many practical services:
- Accessibility: image description, text reading, or object identification.
- Retail: inventory checks, product recognition, and shelf monitoring.
- Agriculture: crop assessment, weed detection, and disease monitoring.
- Wildlife research: camera-trap classification and species counting.
Each domain brings different consequences. An incorrect shelf count may be inconvenient; a missed disease or species may have more serious effects. Test data should reflect the environment, camera placement, and seasonal changes.
Human-in-the-loop systems and effective collaboration
A human–AI system can outperform either component alone when each contributes something useful. The model may handle routine cases quickly; a person may review uncertain or high-impact ones.
But adding a human does not automatically solve the problem. Reviewers can become over-reliant on automation, fatigued by alerts, or unable to notice systematic model errors. Interface design should make uncertainty clear and allow independent judgment.
A sensible workflow includes:
- A clear rule for which cases require review.
- Access to the original image and relevant context.
- A way to disagree with or correct the model.
- Ongoing audits of both machine and human decisions.
- Feedback loops that do not silently contaminate evaluation data.
This is where AI should earn its place: not by winning a benchmark in isolation, but by improving the whole decision process.
🔮 What’s Next for Computer Vision Benchmarks
Real-world, dynamic, and video-based evaluation
Still images are convenient, but many real tasks unfold over time. Future benchmarks will need to assess tracking, event understanding, temporal consistency, and behavior after the system encounters uncertainty.
Video-based evaluation can reveal whether a model maintains object identity across frames, responds to a change in scene, and avoids contradicting itself. It also introduces practical challenges: large data volumes, privacy, annotation costs, and synchronized human comparisons.
Multimodal vision-language benchmarks
Vision-language models combine visual input with language, allowing systems to answer questions, follow instructions, or describe images. These systems are more flexible than fixed-label classifiers, but they bring new risks: plausible-sounding errors, prompt sensitivity, and weak grounding.
A good evaluation should test whether answers are visually supported, not merely fluent. It should also examine how performance changes with rephrased questions, hidden objects, ambiguous scenes, and unfamiliar categories.
Continual learning, data efficiency, and generalization
Real deployments change. A model may need to adapt to new product versions, cameras, seasons, or user needs without forgetting earlier capabilities.
Useful future benchmarks will ask:
- How many examples are needed to adapt?
- Does updating the model damage performance on prior data?
- Can it identify a new category with limited examples?
- How well does it transfer to a new site or device?
- Can its confidence signal detect that adaptation is needed?
These are central questions for organizations building durable AI automation workflows and scalable systems.
More transparent, reproducible, and human-centered testing
Benchmark reports are more useful when they publish data collection details, annotation policies, model settings, uncertainty, and known limitations. Reproducibility helps researchers distinguish genuine progress from a better score produced by a changed protocol.
Human-centered evaluation should also measure more than agreement. It should assess whether people make better decisions with the model, whether the system creates excessive workload, and whether users can identify when it is wrong.
❓ Frequently Asked Questions
How do computer vision models compare with humans in accuracy across real-world tasks?
There is no single winner across all visual tasks. Models can match or exceed human performance on constrained, well-defined tasks with fixed labels and suitable training. People often remain stronger at unfamiliar situations, flexible interpretation, and adapting with little task-specific instruction.
The answer depends on the test. A forced-choice classification benchmark may make a model look stronger than an open-ended task in which a person names an object freely. A fair comparison should use the same images, labels, time limits, and evaluation rules, then report performance by relevant conditions.
Why can two studies reach different conclusions?
Because their tasks, datasets, models, and baselines differ. A recent study reported that CoCa reached about 70% in an unrestricted 1,000-class model evaluation but about 92% in task-specific forced-choice experiments. Those scores describe different setups, not a simple contradiction. Study
Which computer vision benchmarks best measure performance against human perception?
No benchmark captures all of human perception. For classification robustness, combine ImageNet with ObjectNet, ImageNet-A, ImageNet-C, ImageNet-R, or ImageNet-Sketch. For object detection and segmentation, use CO or task-specific datasets such as Cityscapes. For scene parsing, consider ADE20K; for driving perception, consider KITI along with deployment-specific data.
The best benchmark set depends on the application. More importantly, include a human baseline that matches the model’s task and report uncertainty and error patterns—not just the top-line score.
What should I use for a business deployment?
Use public benchmarks for orientation, then validate on representative images from your own environment. Keep a locked holdout set and test important subgroups, devices, and operating conditions before rollout.
Why can AI outperform humans on vision benchmarks but struggle in real-world conditions?
Benchmarks usually define a limited task and a fixed data distribution. Deployment adds new cameras, viewpoints, backgrounds, lighting, rare classes, and workflow constraints. A model may have learned patterns that work well on the benchmark but fail when those patterns change.
Human vision also brings broad prior knowledge and flexible interpretation, though people have their own biases and limitations. The gap is not simply “AI sees pixels, humans understand”; it varies by model, training, task, and context.
Which failures should teams test first?
Start with the changes most likely in your environment: camera replacement, low light, blur, oclusion, new packaging, seasonal variation, and rare high-impact cases. Then review where model errors overlap with human errors. That tells you whether human oversight adds a genuinely different line of defense.
How can businesses use human-versus-AI vision benchmarks to gain a competitive edge?
Use benchmarks to decide where automation is dependable, where human review adds value, and where more data or better imaging is needed. A benchmark should guide investment—not serve as a trophy.
A practical process:
- Define the real decision and the consequences of error.
- Compare candidate systems on a task-matched test set.
- Measure accuracy, latency, throughput, and failure rates.
- Test performance across relevant groups and conditions.
- Route uncertain or high-impact cases to trained reviewers.
- Monitor production data and re-evaluate after changes.
This can reduce repetitive work while preserving human judgment for ambiguous cases. For broader implementation ideas, explore AI business applications and AI automation workflows.
What is the most common mistake companies make?
They treat a public benchmark score as a production guarantee. A high score on familiar test images does not establish accuracy on the company’s cameras, products, users, or operating conditions. The remedy is straightforward: measure on representative local data before deployment and continue monitoring afterward.
Which metric should I use to compare a classifier with people?
For a single-label classification task, top-1 accuracy can be appropriate if the label set and test conditions are matched. Use balanced accuracy or per-class recall when classes are imbalanced. If the system ranks candidates, top-k accuracy may be useful, but report it separately from a single-answer human result.
For detection or segmentation, use localization metrics such as mAP or mean IoU. Do not compare those scores directly with human classification accuracy.
Does higher accuracy always mean a better vision system?
No. A system can be more accurate on average but slower, less robust, poorly calibrated, or worse on an important subgroup. It may also produce errors with higher consequences.
Evaluate the full system: accuracy, error type, confidence, latency, coverage, energy use, and human-review workload. The right model is the one that meets the application’s requirements—not necessarily the one with the largest number on a leaderboard.
Can a model and a person have the same accuracy but different reliability?
Yes. Two observers with equal accuracy may make different errors, agree with one another at different rates, or fail on different categories. A system can be most valuable when its mistakes are complementary to a person’s—provided users can identify and correct those mistakes.
Measure error overlap and confidence calibration alongside accuracy. That reveals whether the model actually adds a useful second opinion or simply repeats the same blind spots.
How should organizations monitor computer vision after deployment?
Track performance on a continuing sample of real cases, with appropriate privacy protections. Monitor shifts input data, error rates, confidence, class balance, and human overrides. Re-test after changes to cameras, products, workflows, or model versions, and keep a documented path for rollback.
Production monitoring is not a one-time “launch check.” It is part of operating the system responsibly.