Support our educational content for free when you purchase through links on our site. Learn more
📊 15 AI Business Value Metrics That Prove What Works

AI business value metrics should show whether AI improves real business outcomes—not just how often people use it or how well a model performs on a test. Start with a clear objective, compare results against a baseline, and track business impact alongside quality, adoption, cost, and risk.
We’ve seen promising pilots lose momentum when teams could show impressive demos but couldn’t answer a simple question: “What got better?” A customer-service assistant, for example, might cut drafting time but still create more repeat contacts if its answers are wrong. Speed is useful; speed plus better outcomes is value.
That measurement gap matters. CIO reports that only half of organizations had moved more than half of their AI projects from pilot to production, citing an OutSystems report. The metrics you choose can help reveal whether an AI initiative is ready to scale, needs a redesign, or should be retired.
Key Takeaways
- Tie AI to a business outcome: Measure revenue, cost, customer experience, productivity, quality, or risk—not activity alone.
- Track 15 useful metrics: From AI ROI and cycle time to adoption, task success, retention, and operating costs.
- Set a baseline before launch: Use a comparison or control group where practical to distinguish AI impact from other changes.
- Measure the whole workflow: Include review time, rework, exceptions, and downstream effects—not only what the model does.
- Balance results with guardrails: Pair speed and savings with quality, trust, security, and compliance measures.
- Count costs honestly: Include implementation, data, training, inference, monitoring, maintenance, and human oversight.
- Make metrics decision-ready: Assign owners and use evidence to decide when to scale, revise, or stop an AI project.
Table of Contents
- ⚡ Quick Tips and Facts: AI Business Value Metrics
- 🧭 Background: Why Measuring AI Business Value Matters
- 📊 What Are AI Business Value Metrics?
- AI metrics, KPIs, ROI, and business outcomes: What’s the difference?
- How AI value measurement differs from traditional IT measurement
- 🎯 15 AI Business Value Metrics That Show What’s Really Working
- 1. Revenue growth and AI-atributed sales
- 2. Cost savings and cost avoidance
- 3. Return on AI investment (AI ROI)
- 4. Employee productivity and time saved
- 5. Process cycle time and throughput
- 6. Customer satisfaction and experience
- 7. Customer retention and churn reduction
- 8. Conversion rates and lead quality
- 9. Quality, accuracy, and error reduction
- 10. Employee adoption and active usage
- 11. Decision speed and decision quality
- 12. Innovation rate and time to market
- 13. Model performance and task success
- 14. Risk, compliance, and incident reduction
- 15. AI operating costs and infrastructure efficiency
- 🧩 How to Choose the Right AI KPIs for Your Business
- Start with a business problem, not a model
- Map AI use cases to strategic objectives
- Choose leading and laging indicators
- Set baselines, targets, and measurement windows
- Assign metric owners and decision rights
- 🧮 How to Calculate AI ROI and Total Cost of Ownership
- A practical AI ROI formula
- Account for implementation, inference, and maintenance costs
- Measure direct, indirect, and strategic value
- Avoid double-counting benefits and hidden costs
- 🛠️ Build an AI Value Measurement Framework
- Assess data readiness and current workflows
- Design pilots with control groups and clear hypotheses
- Track the journey from experiment to scaled impact
- Create an AI value dashboard and reporting cadence
- 🏢 Measuring AI Value Across Business Functions
- Sales and marketing AI metrics
- Customer service and support AI metrics
- Finance, HR, and operations AI metrics
- Software engineering and IT AI metrics
- Generative AI and AI agent value metrics
- ⚖️ Balance Productivity, Customer Experience, and Risk
- Measure employee capabilities beyond time saved
- Track customer and employee experience impacts
- Include responsible AI, security, and compliance indicators
- 📈 Setting Realistic Expectations for AI Business Value
- Why AI benefits take time to appear
- Separate proof of concept success from scaled business impact
- Account for adoption, workflow redesign, and change management
- 🚧 Common AI Measurement Mistakes and How to Avoid Them
- Counting activity instead of outcomes
- Using vanity metrics without business context
- Ignoring model drift, AI debt, and ongoing costs
- 🔮 The Future of AI Value Measurement
- Measuring autonomous AI agents and human oversight
- Continuous evaluation for AI systems in production
- ❓ Frequently Asked Questions About AI Business Value Metrics
- What are the most important AI business value metrics?
- How do you measure the business value of generative AI?
- How long does it take to see ROI from AI?
- How can a company measure AI productivity gains?
- What should an AI value dashboard include?
- Conclusion
- Recommended Links
- Reference Links
⚡ Quick Tips and Facts: AI Business Value Metrics
The short version: AI business value is not measured by how many prompts your team sends, how clever a demo looks, or how proudly a dashboard glows. Measure whether AI changes business outcomes: revenue, cost, service quality, decisions, risk, or the ability to do valuable work that was previously impractical.
| Quick check | What to measure | What not to mistake for value |
|---|---|---|
| 💵 Financial impact | Incremental revenue, avoided costs, total cost of ownership, AI ROI | A projected benefit with no baseline or owner |
| ⚙️ Operational impact | Cycle time, throughput, error rate, rework, service levels | Tasks automated without better outcomes |
| 👥 Adoption and trust | Repeat use, accepted recommendations, override reasons, user feedback | Licenses assigned or logins alone |
| 🧠 Decision quality | Time to decision, decision accuracy, risk avoided | Faster decisions that are poorly informed |
| 🛡️ Risk and responsibility | Incidents, compliance findings, privacy complaints, bias checks | A governance checklist nobody monitors |
| 📈 Growth and innovation | Conversion, retention, new AI-enabled products, time to market | Clicks or leads that never become customers |
A few practical rules we use when evaluating AI programs:
- Start with a business question. “Can AI shorten claims processing without increasing errors?” is measurable. “Can we add a chatbot?” is a feature request.
- Set a baseline before launch. Without a before-and-after comparison, a good result may just be a busy quarter, a staffing change, or plain old seasonality.
- Measure the whole workflow. AI may save drafting time while adding review, correction, and escalation work elsewhere.
- Track technical quality and business results together. Model accuracy matters, but it does not prove customer satisfaction, savings, or adoption. For a helpful primer on technical evaluation, see what the top AI benchmarks measure.
- Keep the first scorecard small. Five to seven well-owned metrics beat a spreadsheet zoo. ThoughtSpot recommends focusing on a small core set and reviewing metrics at different cadences.
- Expect a J-curve. Skills, workflow redesign, governance, and adoption may come before visible financial returns. A quiet first quarter is not automatically a failed initiative; an unmeasured one is harder to defend.
Our rule of thumb: Every AI use case needs at least one business outcome, one adoption or quality check, and one cost or risk guardrail. If it has none, it is a demo wearing a business-case costume.
🧭 Background: Why Measuring AI Business Value Matters

AI investments can look successful in a pilot and still struggle to deliver at scale. A striking example: CIO reports that only 50% of organizations had moved more than half of their AI projects from pilot to production, citing an OutSystems report. That gap is where measurement earns its keep. It helps leaders decide which experiments deserve funding, what needs fixing, and when to stop.
The tricky part is that AI creates value through several routes at once. A support assistant might reduce handling time, improve answer consistency, help new staff ramp up, and create a better customer experience. If we only count “minutes saved,” we miss much of the picture. If we count every possible benefit as cash savings, we risk turning a useful business case into wishful arithmetic.
From AI activity to business outcomes
A metric is useful when it supports a decision. Prompts processed, models deployed, and users invited can help diagnose implementation progress, but they do not prove that the company became more profitable, productive, trusted, or resilient.
| Measurement layer | Example question | Example measures |
|---|---|---|
| AI activity | Is the system being used? | Sessions, calls, tasks submitted |
| Technical performance | Does the system work as intended? | Accuracy, latency, task success, failure rate |
| Workflow impact | Did the work change? | Cycle time, handoffs, rework, escalation |
| Business outcome | Did the change matter to the organization? | Revenue, cost, retention, quality, risk |
| Strategic value | Did AI enable something previously impractical? | New offerings, new capacity, faster innovation |
This distinction explains why a model can score well in a test and still fail commercially. ThoughtSpot’s AI metrics guide makes the same point: technical scores such as accuracy or F1 score need to be tied to practical outcomes. A chatbot’s excellent intent recognition does not help if customers still cannot resolve their issue.
Why leaders need a continuous value signal
AI systems and the workflows around them change. Data shifts. Employees discover workarounds. Usage grows. A model update may improve answer quality but raise inference costs. A useful metric framework therefore acts less like annual report card and more like a business instrument panel.
- Executives need a clear view of revenue, cost, strategic growth, and exposure.
- Department leaders need workflow-level results they can act on.
- Employees need evidence that AI helps them do better work, not just evidence that leadership wants another dashboard.
- Risk, privacy, and security teams need monitoring that continues after deployment.
For more coverage of practical deployments, explore AI Business Applications and AI News. The important question is not “Did we launch AI?” It is “What changed, for whom, at what cost, and how do we know?”
📊 What Are AI Business Value Metrics?
AI business value metrics are measures that show how an AI system contributes to organizational objectives, while accounting for the costs, risks, adoption, and workflow changes involved.
They connect the chain from technology to work to outcomes:
AI capability → changed workflow → measurable result → business value
For example, a sales assistant may summarize account history. That is a capability. A shorter preparation process is a workflow effect. More qualified conversations per representative is an operational result. Higher conversion or revenue per representative may be the business outcome. Each link matters: if the summaries are inaccurate or reps do not trust them, the chain breaks.
AI metrics, KPIs, ROI, and business outcomes: What’s the difference?
These terms are often used as if they were interchangeable. They are not quite the same.
| Term | Meaning | Example |
|---|---|---|
| Metric | A measured quantity | Average minutes spent drafting a support response |
| KPI | A metric tied to an important objective | Resolution time for a customer-support team |
| AI KPI | A KPI used to assess an AI-supported workflow or outcome | First-contact resolution for AI-assisted support |
| Business outcome | The result the organization wants | Higher customer satisfaction or lower service cost |
| ROI | A comparison of benefits against investment | Net financial benefit relative total AI costs |
| Technical metric | A measure of system behavior or model performance | Latency, task success, retrieval relevance |
A technical metric may be a necessary diagnostic, not a business KPI. For example, retrieval relevance can help explain why an employee assistant gives poor answers. It becomes business-relevant when improved retrieval produces fewer incorrect responses, less employee rework, or faster access to reliable information.
How AI value measurement differs from traditional IT measurement
Traditional software is often evaluated on availability, adoption, and delivery cost. AI needs those measures too, but also demands attention to variable inference costs, probabilistic outputs, human review, data quality, model drift, and trust.
An ordinary form typically returns the same output for the same input. An AI system can produce different outputs, be persuasive while wrong, or perform differently as real-world data changes. So we measure both system behavior and the impact of that behavior on people and workflows.
- Technical health: Does the system meet latency, reliability, and quality requirements?
- Workflow health: Are outputs being used, checked, corrected, or ignored?
- Business health: Does the resulting process improve cost, revenue, service, quality, or risk?
- Responsible-use health: Are privacy, fairness, security, and governance controls working?
For AI evaluation concepts such as benchmark selection and model comparisons, see our guide to top AI benchmarks. Benchmarks are useful evidence, but they are not a substitute for evidence from your own workflows and users.
🎯 15 AI Business Value Metrics That Show What’s Really Working
A comprehensive scorecard need not track all 15 measures for every use case. Pick the metrics that fit the intended outcome, then use the rest as a menu when the business case calls for them.
| Metric | Useful for | Example evidence |
|---|---|---|
| Revenue growth | Sales, marketing, new AI products | Incremental revenue versus a credible comparison |
| Cost savings | Operations, service, back office | Reduced cost per completed case |
| AI ROI | Portfolio and investment review | Benefits less costs, relative to investment |
| Productivity | Knowledge work, support, engineering | Quality-adjusted work completed per hour |
| Cycle time | Processes with handoffs or queues | Time from intake to completion |
| Customer satisfaction | Service and customer-facing AI | CSAT, effort score, complaint trends |
| Retention | Subscription and relationship businesses | Renewal or repeat-purchase changes |
| Conversion | Sales and marketing journeys | Incremental conversion, not just clicks |
| Quality and errors | High-stakes or repetitive workflows | Defect, rework, and correction rates |
| Adoption and trust | Any employee- or customer-facing system | Repeat use, acceptance, override reasons |
| Decision speed and quality | Management, risk, operations | Time to decision plus decision outcomes |
| Innovation and time to market | Product and service development | New offers and launch cycle time |
| Task success | Assistants, agents, automation | Correctly completed tasks, including exceptions |
| Risk and compliance | Regulated or sensitive use cases | Incidents, audit findings, policy violations |
| AI operating efficiency | Model and platform operations | Cost per successful outcome |
1. Revenue growth and AI-atributed sales
Measure incremental revenue, not merely revenue that happened after an AI tool was introduced. Useful indicators include:
- AI-influenced conversion rate
- Revenue per lead, seller, agent, or customer contact
- Average order value and deal size
- Sales-cycle duration
- Revenue from new AI-enabled products or services
- Revenue from customer segments the business could not previously serve efficiently
Use a comparison group or a careful experiment where possible. If AI-assisted sales representatives close more deals, ask whether they had different territories, lead quality, or experience. Attribution is a detective story; the AI tool should not get credit for every plot twist.
2. Cost savings and cost avoidance
Track cost reduction at the process level, including labor, software, infrastructure, review, and rework. Cost avoidance is different from savings realized in the financial statements: preventing future hiring or avoiding a service failure can have value, but should be reported as a forecast or avoided cost rather than booked as cash saved unless the expense truly disappears.
Useful measures include:
- Cost per completed task or case
- Manual hours eliminated or redeployed
- Overtime and contractor expense
- Error-related refunds, credits, or repeat work
- Avoided service outages or compliance remediation
3. Return on AI investment (AI ROI)
A simple ROI calculation is:
AI ROI (%) = (measurable benefits − total AI costs) ÷ total AI costs × 100
The hard work is defining “measurable benefits” and “total costs.” Include implementation, integration, data preparation, employee training, human review, ongoing monitoring, security, and operating costs. Report financial savings separately from less directly monetized benefits such as lower risk or improved customer experience.
4. Employee productivity and time saved
Time saved is a starting point, not the finish line. Measure whether saved time becomes more output, better quality, higher-value work, or improved service. For example, a developer who completes a code change faster may spend the remaining time on testing, documentation, or another backlog item. If that time is simply absorbed by waiting, the business outcome may be smaller than expected.
Pair time measures with quality:
- Tasks completed per employee or team
- Time spent on routine work versus higher-value work
- Rework and defect rates
- Employee-reported usefulness and workload
- Output quality assessed using consistent criteria
5. Process cycle time and throughput
Cycle time measures how long work takes from start to finish; throughput measures how much work gets completed in a period. AI might accelerate one step while creating a new review queue, so track the whole process, not only the AI interaction.
Examples include claims processed per day, time from support ticket to resolution, contract review turnaround, and order exceptions cleared without escalation.
6. Customer satisfaction and experience
For customer-facing AI, measure the experience as customers feel it—not just how the model classifies an intent. Track CSAT, customer effort, complaint rates, repeat contacts, abandonment, escalation, and resolution quality. Segment results by issue type and customer group; a good overall average can hide a miserable experience for people with complex cases.
7. Customer retention and churn reduction
Compare renewals, repeat purchases, and churn for customers exposed to the AI feature against an appropriate baseline. Record reasons for cancellations and opt-outs, particularly when the AI feature uses customer data. CIO’s coverage of AI business value highlights the importance of monitoring customer trust alongside retention.
8. Conversion rates and lead quality
A recommendation engine may increase clicks without improving purchases. A lead-scoring model may deliver more leads but fewer qualified conversations. Track the full funnel: qualified leads, conversion, order value, sales-cycle time, and customer acquisition cost. If results improve, verify that the change is incremental rather than a shift in traffic or campaign mix.
9. Quality, accuracy, and error reduction
Measure defects and downstream consequences, not just model accuracy. For generative AI, quality may include factual grounding, completeness, tone, policy compliance, and whether a human must correct the output. For prediction systems, track the cost of false positives and false negatives; a single accuracy score can conceal an expensive mistake pattern.
10. Employee adoption and active usage
Adoption is more than access. Track eligible users who return, tasks where the tool is used, recommendations accepted, and reasons for overrides. An override is not automatically a failure: it may be the correct human decision. Repeated overrides for the same issue, however, can reveal bad data, poor workflow fit, or a trust problem.
11. Decision speed and decision quality
Measure time from question to decision, then check what happened afterward. Faster decisions can be valuable when they are more timely and sufficiently accurate. In risk or security operations, pair time-to-detect with time-to-remediate; in commercial settings, link decision speed to deals progressed, opportunities saved, or resources allocated more effectively.
As CIO notes, decision-speed measures may reveal business change more clearly than headcount alone. The strongest case connects faster decisions to a concrete outcome.
12. Innovation rate and time to market
AI may create value by enabling a service or product that was previously too costly or too slow to deliver. Track new offerings launched, time from idea to release, revenue or adoption of AI-enabled products, and experiments that reach production. Count the successful capability, not just the number of pilots; a hundred pilots can still be a very expensive way to avoid shipping.
13. Model performance and task success
Use technical metrics to diagnose the system and task-level measures to evaluate whether it completes the intended work. Depending on the use case, monitor:
- Accuracy, precision, recall, F1 score, or ranking relevance
- Response latency, uptime, and failure rate
- Groundedness, citation quality, and policy adherence
- Correct task completion and successful handoffs
- Performance across data segments and edge cases
These are guardrails and diagnostic signals. They become evidence of business value only when tied to workflow and outcome measures.
14. Risk, compliance, and incident reduction
Track AI-related security events, privacy complaints, audit findings, unauthorized data exposure, policy violations, bias indicators, and remediation time. A low incident count is encouraging, but weak reporting can make it misleading. Pair incident metrics with control testing, user reporting channels, and documented review.
The NIST AI Risk Management Framework offers a voluntary approach for incorporating trustworthiness and risk management across AI design, development, deployment, and use.
15. AI operating costs and infrastructure efficiency
AI economics include more than model API calls. Measure compute, data storage, orchestration, evaluation, security, human review, and monitoring. For generative systems, track cost per successful, accepted outcome, not only cost per token or request.
A useful question is: Are AI costs growing faster than the value produced? If so, investigate prompt length, model choice, repeated calls, retrieval quality, caching, workflow design, and unnecessary human correction. For updates on the platforms and infrastructure behind these systems, browse AI Infrastructure.
🧩 How to Choose the Right AI KPIs for Your Business
The right KPI depends on what the AI system is supposed to change. A customer-service assistant and a fraud model should not share a generic “AI success score.” One affects service interactions; the other changes risk decisions.
Start with a business problem, not a model
Write a clear problem statement before selecting technology. For example:
“We want to reduce the time required to resolve routine billing questions without increasing repeat contacts, incorrect answers, or customer effort.”
This gives the team an outcome, a population, and guardrails. Compare it with “We want a generative AI chatbot.” The latter describes a possible solution but says nothing about what success means.
Map AI use cases to strategic objectives
Build a short chain from use case to company goal:
| Business objective | AI-supported workflow | Primary metric | Guardrail |
|---|---|---|---|
| Improve customer service | Draft answers for support agents | Resolution time | Repeat contact and CSAT |
| Grow sales | Recommend next-best action | Incremental conversion | Returns, complaints, margin |
| Reduce processing burden | Extract fields from documents | Cost per completed case | Error and rework rate |
| Improve security response | Prioritize alerts | Time to remediation | Missed critical incidents |
| Speed product development | Assist coding and testing | Delivery cycle time | Defects and security findings |
This structure also helps teams separate AI value from the value of unrelated process changes.
Choose leading and laging indicators
Leading indicators provide an early signal: adoption, accepted recommendations, task success, or time to first use. Laging indicators show realized outcomes: revenue, retention, cost, customer satisfaction, or incidents.
Use both. A pilot may show strong adoption but no financial benefit yet; that can be an early signal to keep testing, not a license to declare victory.
Set baselines, targets, and measurement windows
- Define the population. Which employees, customers, cases, or transactions are included?
- Measure the existing process. Record volume, time, cost, quality, and exceptions.
- Choose a comparison. Use a control group, phased rollout, matched cohort, or historical comparison where appropriate.
- Set a target and guardrails. Specify the result you want and the quality or risk limits you will not cross.
- Choose the time window. Include enough time to capture adoption, seasonality, and downstream effects.
- Document assumptions. Note staffing, training, data, and workflow changes that could affect results.
Do not borrow a benchmark target without checking whether it fits your data, process, and maturity. Published case studies can inspire hypotheses; your baseline determines whether the hypothesis holds at your company.
Assign metric owners and decision rights
Each metric needs a person or team responsible for its definition, data, interpretation, and response. A dashboard without an owner is a weather station nobody checks.
- Business owner: accountable for the outcome
- AI or product owner: responsible for system performance and roadmap
- Data owner: accountable for data definitions and quality
- Risk and compliance partners: review relevant controls
- Finance partner: validates financial assumptions and realized benefits
For teams building automated measurement pipelines and workflows, see AI Automation Workflows.
🧮 How to Calculate AI ROI and Total Cost of Ownership
AI ROI can be estimated, but it should be presented with assumptions and confidence levels. The calculation is only as credible as its baseline, attribution, and cost inventory.
A practical AI ROI formula
Start with:
AI ROI (%) = (annualized measurable benefits − total AI investment and operating costs) ÷ total AI investment and operating costs × 100
For a broader business case, show the value categories separately rather than forcing everything into one number:
| Benefit or cost | Example |
|---|---|
| Revenue gain | Incremental sales attributable to AI-assisted recommendations |
| Cost reduction | Lower cost per case after including review and rework |
| Cost avoidance | Future expense avoided, reported separately from realized savings |
| Risk reduction | Reduced expected loss or incident exposure |
| Strategic value | New product capability or expanded service capacity |
| Upfront investment | Integration, data preparation, engineering, procurement |
| Ongoing expense | Inference, hosting, monitoring, support, security |
| Human effort | Training, review, exception handling, correction |
Account for implementation, inference, and maintenance costs
A responsible cost model includes the full lifecycle:
- Discovery, vendor assessment, and legal review
- Data cleansing, labeling, access controls, and integrations
- Model or platform usage, hosting, and storage
- Testing, red teaming, evaluation, and monitoring
- Employee training and change management
- Human review, correction, and escalation
- Maintenance, model updates, and incident response
A common surprise is review labor. An AI assistant may draft quickly, yet every output may require a specialist to verify it. The workflow still might be worthwhile, but that work belongs in the calculation.
Measure direct, indirect, and strategic value
- Direct value: measurable operating-cost reduction or incremental revenue.
- Indirect value: improved quality, lower effort, faster response, or reduced risk.
- Strategic value: products, services, or capacity made possible by AI.
Direct value is usually easier to validate. Strategic value can be substantial but should be labeled clearly, with evidence and assumptions. Don’t bury uncertain estimates inside “savings.”
Avoid double-counting benefits and hidden costs
If an AI tool saves 10 minutes per employee per day, do not automatically multiply those minutes by salary and call the result cash savings. Ask whether staffing costs fell, output increased, overtime decreased, or capacity was redeployed to work that matters. Report capacity released separately from cash realized.
Also watch for double-counting: a faster process may already account for the same labor savings claimed under productivity. Finance and business owners should agree on a single benefit ledger before reporting portfolio totals.
🛠️ Build an AI Value Measurement Framework
A useful framework is repeatable across use cases but flexible enough to reflect each workflow. Think of it as a shared recipe, not a one-size-fits-all KPI menu.
Assess data readiness and current workflows
Before deployment, map:
- Where data comes from and who is permitted to use it
- How work flows today, including exceptions and informal workarounds
- Existing service, quality, cost, and risk baselines
- Which users and customers are affected
- What happens when AI is unavailable or wrong
This is where teams often discover that the bottleneck is not a lack of AI. It is incomplete data, a confusing approval path, or a process held together by one expert’s memory.
Design pilots with control groups and clear hypotheses
A good pilot tests a specific hypothesis, such as: “AI-assisted agents will resolve eligible questions faster, with no decline in customer satisfaction or increase in repeat contacts.”
- Define eligible cases and excluded edge cases.
- Record baseline performance for comparable cases.
- Train users and document the intended workflow.
- Run the pilot with appropriate human oversight.
- Compare outcomes with a control or matched group.
- Review cost, quality, user feedback, and incidents.
- Decide whether to scale, revise, or stop.
For high-impact or sensitive use cases, involve risk and compliance teams before the pilot. The NIST AI RMF provides a useful reference for structuring risk considerations.
Track the journey from experiment to scaled impact
Track milestones separately so that a technical win is not mistaken for a business win.
| Stage | Evidence to collect | Decision |
|---|---|---|
| Discovery | Problem, baseline, user needs, risk review | Is the use case worth testing? |
| Pilot | Quality, usability, workflow impact, cost | Does the hypothesis hold? |
| Production launch | Reliability, adoption, support readiness | Can it operate safely? |
| Scale | Unit economics, variation across teams, outcomes | Is wider deployment justified? |
| Ongoing operation | Drift, trust, incidents, value trend | Should the system be tuned, expanded, or retired? |
CIO’s reporting describes a gap between AI pilots and production adoption. Tracking stage-to-stage conversion helps leaders see where projects stall rather than treating the entire portfolio as a pile of demos.
Create an AI value dashboard and reporting cadence
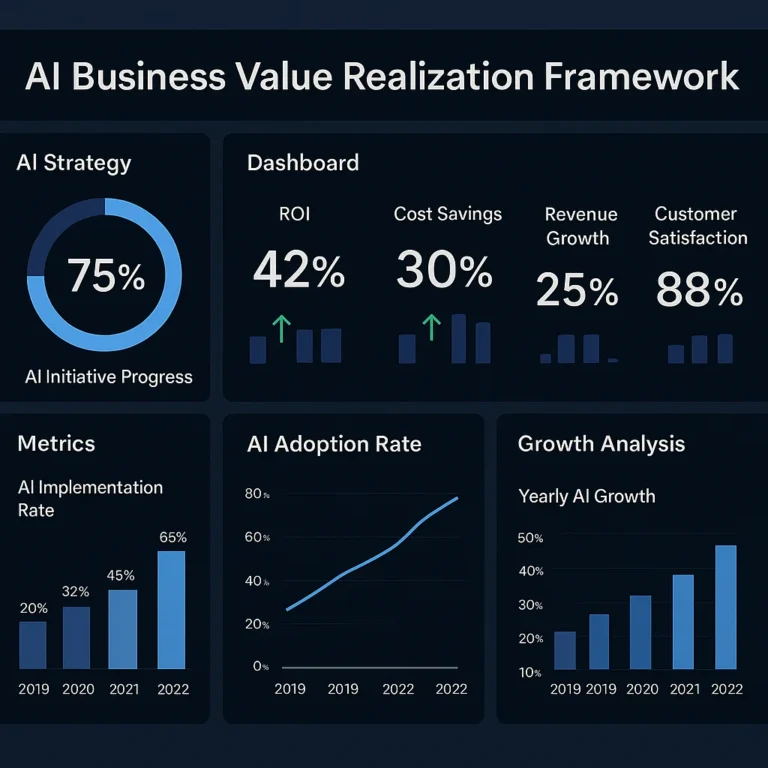
A practical dashboard can include:
- Outcome: the core business KPI and baseline
- Workflow: cycle time, throughput, exception rate
- Quality: error, rework, task success, escalation
- Adoption: eligible-user reach, repeat use, override reasons
- Economics: total cost and cost per accepted outcome
- Risk: incidents, compliance checks, remediation
- Confidence: data freshness, comparison method, attribution limits
Review operational signals frequently, business trends periodically, and the metric framework itself on a regular strategic cadence. ThoughtSpot recommends monitoring core metrics weekly, reviewing trends monthly, and revisiting the framework quarterly. The exact calendar should match your business cycle and risk profile.
🏢 Measuring AI Value Across Business Functions
The same AI capability can produce different value in different departments. A summarizer in sales might improve preparation; in legal, it might help locate clauses; in customer support, it might reduce after-call work. The metric should match the actual job.
Sales and marketing AI metrics
Track the funnel, not a single attractive number:
- Qualified pipeline and conversion by segment
- Revenue per representative or campaign
- Average deal size and sales-cycle length
- Return on ad spend, with an appropriate comparison
- Customer acquisition cost and customer lifetime value
- Recommendation acceptance, returns, and complaint rates
A recommendation that drives a click but not a profitable purchase is an expensive confetti cannon. Pair engagement with downstream sales, margin, and customer outcomes.
Customer service and support AI metrics
Measure the experience from the customer’s perspective as well as agent efficiency:
- First-contact resolution
- Time to resolution and time to first response
- Repeat contacts, escalation, abandonment
- Customer satisfaction and customer effort
- Agent after-contact work and cases handled
- Accuracy, policy adherence, and unresolved issue rate
Segment by issue complexity. AI may work beautifully for address changes and poorly for a sensitive billing dispute. Averaging them together is how useful insight goes to hide.
Finance, HR, and operations AI metrics
For finance and operations, track processing time, exception rates, forecast quality, manual reconciliation, and audit findings. In HR, consider time to fill, candidate communication quality, employee experience, fairness reviews, and privacy controls. Do not treat a hiring model’s throughput as success if it harms fairness or candidate trust.
In all three areas, distinguish administrative efficiency from decision quality. A faster forecast is not useful if it makes worse resource decisions; a faster screening workflow is not acceptable if it introduces unacceptable bias.
Software engineering and IT AI metrics
For coding assistants and IT operations, pair productivity with quality and operational health:
- Lead time for changes and deployment frequency
- Defect escape rate, rollback rate, and security findings
- Time to restore service and incident recurrence
- Developer satisfaction and code review workload
- Percentage of AI-generated changes accepted without substantial rework
Measure team-level outcomes carefully. More code produced is not automatically more valuable software; sometimes it is simply a larger future maintenance bill. Explore AI Infrastructure for the systems that support deployment and evaluation.
Generative AI and AI agent value metrics
Generative AI and agents need measures for both output quality and task completion. Useful indicators include:
- Task completion rate, including correct handling of exceptions
- Human acceptance and meaningful edit rate
- Citation or source-grounding quality
- Escalation frequency and unsafe-action prevention
- Cost per successful task
- Human minutes required per completed workflow
- Reversal, rollback, or correction rate for agent actions
For agents that can call tools or take actions, measure permission boundaries, approval rates, and recovery from failure. A fast agent that makes unauthorized changes is not efficient; it is a very energetic incident report. See AI Agents for related coverage.
⚖️ Balance Productivity, Customer Experience, and Risk
AI value is not a tug-of-war between innovation and governance. Risk controls can help preserve customer trust, reduce rework, and make it safer to scale a successful workflow.
Measure employee capabilities beyond time saved
Time saved can matter, but the wider question is what people can now do better or at greater scale. Measure access to institutional knowledge, time to answer internal questions, decision quality, workload mix, and capacity per employee.
CIO’s article emphasizes that decision-speed measures can tell a different story from headcount measures: AI may change how the business operates without replacing a role. Track whether employees can self-serve reliable knowledge or spend less time waiting for a subject-matter expert, while preserving appropriate expert review for consequential decisions.
Track customer and employee experience impacts
Look for outcomes that connect experience to operations:
- Customer effort, repeat contact, and complaint themes
- Employee confidence, workload, and tool usefulness
- Exceptions resolved without unnecessary escalation
- Time to identify and fix a service issue
- Trust, opt-out, and consent patterns where relevant
A workflow may get faster while feeling worse. Automated replies can reduce response time but frustrate customers who need a person. The balanced scorecard catches that trade-off before the business celebrates a metric that customers are actively trying to escape.
Include responsible AI, security, and compliance indicators
The right controls depend on the use case, but common measures include:
- Privacy and security incidents
- Unauthorized data access or disclosure
- Bias and performance differences across relevant groups
- Audit completeness and policy exceptions
- Human review coverage for sensitive decisions
- Explanation, appeal, or correction processes
- Time to detect and remediate AI-related issues
Use a risk framework rather than inventing controls from scratch. NIST’s AI Risk Management Framework provides guidance for identifying, assessing, managing, and monitoring AI-related risks.
📈 Setting Realistic Expectations for AI Business Value
An AI business case is a hypothesis to test, not a promise that the system will print savings on schedule. Benefits may arrive only after users trust the tool, teams redesign the process, and operations learn how to manage failures.
Why AI benefits take time to appear
Early investment often goes into data access, integration, employee training, review processes, security, and evaluation. Usage can rise before business results do. That temporary gap is sometimes described as a productivity J-curve: capability and activity develop first; measurable outcomes follow as teams adapt.
This does not mean “wait indefinitely.” Set milestones and a decision date. If adoption rises but quality, workflow impact, and outcomes remain flat, investigate the cause. If costs rise and no credible path to value appears, change scope or stop.
Separate proof of concept success from scaled business impact
A proof of concept can establish that a model performs a task. Production success requires much more:
| Proof of concept asks… | Production asks… |
|---|---|
| Can it produce a plausible output? | Does it work reliably with real users and real data? |
| Does the sample look promising? | Does the workflow improve compared with a baseline? |
| Is the technical demo impressive? | Can it be operated, governed, supported, and afforded at scale? |
| Can one team use it? | Does performance hold across teams, cases, and edge conditions? |
A polished demo is a useful beginning, not a victory lap. The production test is whether the result survives normal business messiness.
Account for adoption, workflow redesign, and change management
Adoption depends on whether the tool fits real work, whether employees trust it, and whether managers reinforce appropriate use. Track onboarding, repeat usage, help requests, overrides, and employee feedback. If adoption is weak, ask whether the tool is hard to access, poorly integrated, or solving a problem users do not have.
Training should cover when to use AI, how to verify outputs, what data not to enter, and how to escalate errors. Better tools and clearer workflows can be as valuable as a new model.
The first YouTube video embedded above, “Why Your AI Strategy is Failing: 4 Metrics to Track Instead”, may help frame this practical discussion. Its 2026 focus treats AI as a business utility and emphasizes evaluating cost, reliability, governance, and value. Use it as a conversation starter, then adapt the metrics to your own use case.
🚧 Common AI Measurement Mistakes and How to Avoid Them
Counting activity instead of outcomes
Prompts, users, automated tasks, and model calls are activity measures. They can help explain adoption or cost, but not whether the business benefited.
Fix: Connect activity to workflow results and business outcomes. For example, report the share of eligible cases handled with assistance, the resulting resolution quality, and the cost per successful case.
Using vanity metrics without business context
Accuracy, clicks, and speed can be useful in the right context. Alone, they can mislead. A very fast recommendation system that causes unprofitable purchases is not a revenue engine.
Fix: Pair every headline metric with a contextual measure:
- Accuracy plus error cost and downstream quality
- Speed plus resolution or decision quality
- Adoption plus accepted use and user outcomes
- Click-through plus conversion, margin, and returns
- Automation plus human review and exception handling
Ignoring model drift, AI debt, and ongoing costs
AI systems need ongoing maintenance. Data changes, model behavior shifts, users invent workarounds, and integrations become brittle. Monitoring only at launch is like checking a smoke alarm once and assuming the battery will last forever.
Fix: Set alerts for performance deterioration, cost growth, failure patterns, and quality by segment. Maintain an owner for model updates and workflow changes. Include technical and process maintenance in the total cost of ownership.
🔮 The Future of AI Value Measurement
Measurement is moving from static reports toward continuous evidence tied to live workflows. That shift could make it easier for teams to spot changes early, but it also raises questions about data quality, metric ownership, and automated decision oversight.
Measuring autonomous AI agents and human oversight
As AI agents gain the ability to search, write, call tools, or execute multi-step tasks, a single “task completed” metric will not be enough. Teams will need to know:
- Did the agent complete the right task?
- Did it respect permissions and policy?
- Were its actions reversible and traceable?
- How often did a human need to approve, correct, or intervene?
- What did each successful task cost, including oversight?
Explore more on the changing field through AI Agents and AI Automation Workflows. The goal is not to remove every human check. It is to place review where it meaningfully reduces risk and improves results.
Continuous evaluation for AI systems in production
Production evaluation should reflect real traffic, real exceptions, and real users. That means combining automated tests with human review, workflow data, feedback channels, and incident analysis.
A strong evaluation loop:
- Monitor system quality and operational health.
- Sample outputs and actions for review.
- Compare performance across relevant user and case segments.
- Investigate overrides, complaints, and rework.
- Update the system or workflow, then validate the change.
- Check whether the business outcome improved—not only the model score.
This is where technical benchmarks and business metrics work together: one helps assess system capability, the other verifies whether that capability creates value in practice.
❓ Frequently Asked Questions About AI Business Value Metrics
How do you measure the business value of AI?
Start by defining the business outcome the AI use case is expected to improve, such as revenue, service quality, cost, cycle time, or risk. Record a pre-AI baseline, choose a meaningful comparison, and track the full workflow after launch.
A balanced measurement set usually includes:
- One or more business outcome metrics
- Workflow measures such as cycle time and throughput
- Quality and adoption measures
- Costs, including implementation and human review
- Risk and trust guardrails
Use a control group or phased rollout when practical to help distinguish AI impact from other changes. Report uncertain or indirect benefits separately from realized financial results.
Which AI metrics best demonstrate competitive advantage?
The most persuasive metrics show that AI helps your organization do something meaningfully better, faster, safer, or at greater scale than its prior process or relevant alternatives. Depending on the strategy, that may include revenue from AI-enabled offerings, customer retention, decision speed and quality, time to market, or higher-value work per employee.
Competitive advantage is rarely proved by a technical score alone. A model benchmark may demonstrate capability; customer outcomes and operating results show whether that capability matters. See our AI benchmark explainer for how technical evaluations fit into the bigger picture.
How can businesses calculate ROI from AI initiatives?
Use the formula:
AI ROI (%) = (measurable benefits − total AI costs) ÷ total AI costs × 100
Include direct benefits such as incremental revenue or verified cost reduction. Include costs such as integration, data preparation, training, model usage, monitoring, security, human review, and maintenance. Report cost avoidance and strategic value separately when they are not realized cash benefits.
Avoid counting capacity released as cash savings unless the expense actually falls. If employees spend less time one task but use that time for other valuable work, report the capacity improvement and identify what it enabled.
What KPIs show whether AI is improving business performance?
Choose KPIs based on the use case rather than applying the same AI scorecard everywhere. Common business KPIs include:
- Incremental revenue and conversion
- Cost per completed task or case
- Cycle time and throughput
- Customer satisfaction, retention, and effort
- Defect, error, and rework rates
- Decision speed and quality
- Employee productivity and adoption
- Risk incidents, compliance findings, and remediation time
Pair each primary KPI with a guardrail. For example, if the goal is faster support resolution, monitor repeat contacts and customer satisfaction so that “fast” does not quietly become “fast but wrong.”
How many AI business value metrics should we track?
Start with five to seven core metrics for each initiative or portfolio view. Choose measures that cover outcomes, workflow, quality, adoption, cost, and risk. Add specialized metrics when the core set is stable and a clear decision requires them.
Too many metrics create reporting work without necessarily improving decisions. Too few can hide trade-offs. The right set is the smallest one that helps the team decide whether to scale, adjust, or stop.
How do you measure generative AI when its outputs are subjective?
Define quality criteria for the actual task: factuality, completeness, tone, source support, policy compliance, and usability. Use a consistent rubric, sample outputs for human review, and compare results with the prior process.
Then connect quality to workflow outcomes: accepted drafts, edit time, resolution quality, rework, or customer feedback. For high-impact tasks, include mandatory review and track whether reviewers catch material errors. Do not rely on “looks good to us” as the entire evaluation plan.
How should businesses account for AI risk and customer trust?
Treat risk and trust as operating measures, not a one-time approval checkbox. Track incidents, privacy complaints, opt-outs where relevant, audit findings, fairness checks, escalation, and time to remediate. Also make sure users and customers have clear ways to correct errors or reach a human when needed.
For structured guidance, consult the NIST AI Risk Management Framework. Its risk-management approach helps teams consider trustworthiness throughout an AI system’s lifecycle.
When should we scale, revise, or stop an AI project?
Scale when the use case improves its target outcome, stays within quality and risk limits, has acceptable unit economics, and works reliably with real users. Revise when the problem is promising but adoption, workflow fit, data quality, or performance is weak and there is a credible fix. Stop when the business case no longer holds, harms exceed benefits, or repeated tests show no realistic route to value.
Set these decision criteria before launch. Otherwise, teams may keep a weak initiative alive because a lot of effort has already gone into it—a very human instinct, and a very expensive one.