Support our educational content for free when you purchase through links on our site. Learn more
12 Key Differences Between Training & Testing Metrics for AI (2025) 🤖
Have you ever trained an AI model that dazzled you with near-perfect accuracy during development, only to flop spectacularly when faced with real-world data? If so, you’re not alone. The secret sauce to avoiding this common pitfall lies in truly understanding the key differences between training and testing metrics—the twin pillars of AI model evaluation.
In this article, we’ll unravel why training metrics are your model’s learning diary, while testing metrics serve as the ultimate exam scorecard. Along the way, we’ll expose the sneaky traps of overfitting, underfitting, and data leakage that can sabotage your AI’s performance. Plus, we’ll share insider tips from ChatBench.org™’s AI researchers on choosing the right metrics for your problem, visualizing them effectively, and interpreting what those numbers really mean. Stick around for real-world examples from Netflix, Tesla, and Google that show how the pros master these metrics to build AI that works in the wild.
Ready to turn your AI insights into a competitive edge? Let’s dive in!
Key Takeaways
- Training metrics measure how well your model learns from known data and guide optimization during development.
- Testing metrics evaluate your model’s ability to generalize to unseen data, providing an unbiased performance estimate.
- The gap between training and testing metrics reveals overfitting (memorizing training data) or underfitting (model too simple).
- Avoid data leakage to prevent artificially inflated metrics that doom your model in production.
- Choose metrics wisely: accuracy isn’t always king—consider precision, recall, F1-score, and domain-specific metrics like IoU or RMSE.
- Use tools like TensorBoard, Weights & Biases, and Evidently AI to visualize and monitor your model’s performance over time.
- Industry leaders like Netflix and Tesla rely on rigorous training/testing metric evaluation and continuous monitoring to keep AI robust and trustworthy.
👉 Shop ML Experimentation Platforms on:
- Paperspace: https://www.paperspace.com/gradient/enterprise |
- RunPod: https://www.runpod.io/serverless-gpu |
- DigitalOcean: https://www.digitalocean.com/products/paperspace
Table of Contents
- ⚡️ Quick Tips and Facts About AI Model Evaluation Metrics
- 🔍 Demystifying AI Model Metrics: Training vs. Testing Explained
- 📚 The Evolution of AI Model Evaluation: From Basics to Best Practices
- 🧠 Understanding Training Metrics: What They Tell You About Your Model
- 🧪 Testing Metrics Uncovered: How to Measure Real-World AI Performance
- ⚖️ 12 Key Differences Between Training and Testing Metrics You Must Know
- 🚦 Overfitting vs. Underfitting: How Metrics Reveal Your Model’s Health
- 🔄 Cross-Validation and Its Role in Reliable Model Evaluation
- 🛠️ Preparing Your Dataset: Avoiding Data Leakage for Honest Metrics
- 📊 Choosing the Right Metrics for Classification, Regression, and Beyond
- 🤖 Real-World Examples: How Industry Leaders Use Training and Testing Metrics
- 🔍 Visualizing Metrics: Tools and Techniques to Track Model Performance
- 🧩 Beyond Accuracy: Exploring Precision, Recall, F1 Score, and More
- 📈 Monitoring AI Models Post-Deployment: Why Testing Metrics Still Matter
- 💡 Tips to Improve Your Model Based on Training and Testing Metric Insights
- 🌐 Join the AI Metrics Conversation: Communities and Resources
- 📝 In Summary: Mastering Training vs. Testing Metrics for AI Success
- 🔗 Recommended Links for Deep Dives on AI Model Evaluation
- ❓ FAQ: Your Burning Questions About Training and Testing Metrics Answered
- 📚 Reference Links and Further Reading on AI Model Metrics
Here is the main body of the article, written according to your specifications.
⚡️ Quick Tips and Facts About AI Model Evaluation Metrics
Welcome to the trenches, fellow AI enthusiasts! Here at ChatBench.org™, we’ve spent countless nights staring at scrolling logs and metric dashboards. Before we dive deep, here are some hard-won truths to get you started:
- Training vs. Testing Analogy: Think of training metrics as your model’s homework scores. They show it’s learning the material. Testing metrics are the proctored, final exam. They prove your model can apply its knowledge to problems it’s never seen before.
- The Overfitting Trap: When your training accuracy is 99% but your testing accuracy is a dismal 60%, your model has overfit. It’s like a student who memorized the answer key but didn’t learn the concepts. ❌
- The Underfitting Slump: If both your training and testing metrics are low, your model is underfitting. It’s too simple to grasp the patterns, like a student who didn’t open the book at all. 📉
- Accuracy Can Be a Liar: In datasets where one class dominates (e.g., 99% non-fraudulent transactions, 1% fraudulent), a model can achieve 99% accuracy by simply guessing “not fraud” every time. This is why metrics like Precision, Recall, and F1-Score are often more insightful.
- Data Leakage is AI’s Cardinal Sin: This happens when your model accidentally gets a “cheat sheet” during training—information from the test set leaks in. This leads to fantastic metrics in development and catastrophic failure in the real world.
- The Holy Trinity of Data Splits: Every serious ML project uses three distinct datasets. Here’s the breakdown:
| Dataset | Purpose | Analogy |
|---|---|---|
| Training Set | The data the model learns from directly. | The textbook and homework problems. |
| Validation Set | Used to tune model settings (hyperparameters) and prevent overfitting. | The practice quizzes and mock exams. |
| Test Set | The final, unseen data used to evaluate the model’s real-world performance. | The final, supervised exam. |
🔍 Demystifying AI Model Metrics: Training vs. Testing Explained
Ever had that sinking feeling when your AI model, which was acing every task in the lab, suddenly falls flat on its face in the real world? It’s a classic tale in machine learning, and the culprit is almost always a misunderstanding of the difference between training and testing metrics. Understanding what are the key benchmarks for evaluating AI model performance? is the first step to building models that don’t just work, but thrive.
Think of it this way: you’re coaching a rookie quarterback.
-
Training Metrics are what you see during practice drills. You’re watching their completion percentage against a defense that knows the plays you’re running. You use this feedback to tweak their throwing motion, footwork, and decision-making. The goal here is optimization—making the quarterback better at executing the plays they’re learning.
-
Testing Metrics are their stats during a real game, against an opponent they’ve never faced. This is the moment of truth. Can they generalize what they learned in practice to a dynamic, unpredictable environment? The goal here is evaluation—measuring their true ability to perform under pressure.
Your AI model is that rookie quarterback. The training metrics (like loss and accuracy on the training data) tell you if the model’s internal “weights” are adjusting correctly. The testing metrics (the same metrics, but on the held-out test set) tell you if that learning actually created a useful, generalizable skill.
📚 The Evolution of AI Model Evaluation: From Basics to Best Practices
In the early days of machine learning, life was simpler. We often just threw accuracy at a problem and called it a day. But as our ambitions grew, so did our understanding of evaluation’s nuances. We quickly ran into what the team at Evidently AI calls the “Accuracy Paradox”: high accuracy can be incredibly misleading on imbalanced datasets.
This led to a Cambrian explosion of more sophisticated metrics. We realized we needed to ask better questions:
- When a model predicts something is positive, how often is it right? Hello, Precision.
- Of all the actual positive things, how many did our model find? Welcome, Recall.
- How can we balance the two? Enter the F1-Score.
More recently, the scientific community has pushed for even more rigor. A groundbreaking 2024 paper in Nature emphasizes that just comparing two metric scores isn’t enough. We need to use statistical tests like the Wilcoxon signed-rank test to determine if the performance difference between two models is actually significant or just a fluke. The paper notes, “The threshold should be always chosen based on the predictions of the training set only because using the threshold that maximizes the accuracy of the predictions of thetest set produces unrealistically good results.” This highlights the critical separation needed between training-phase tuning and final testing.
The journey has been from a single, often-flawed number to a rich, multi-faceted dashboard that gives us a holistic view of a model’s true capabilities.
🧠 Understanding Training Metrics: What They Tell You About Your Model
Training metrics are your model’s diary. They are calculated on the very data the model is using to learn, often after every batch or epoch (a full pass through the training data). They provide a real-time feed of the learning process.
H3: The Learning Curve: Your First Diagnostic Tool
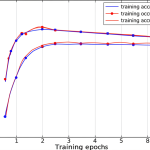
The most fundamental use of training metrics is plotting them over time to create a learning curve. This simple graph of “loss” or “accuracy” vs. “epochs” is your number one diagnostic tool.
- What you want to see: A steady, downward-sloping loss curve and an upward-sloping accuracy curve that begins to plateau. This means your model is successfully learning the patterns in the data. ✅
- What you don’t want to see: A loss curve that’s flat, erratic, or even increasing. This is a red flag! 🚩 It could mean your learning rate is too high, your model architecture is flawed, or your data is just noise.
H3: The Crucial Role of the Validation Set
Here’s a pro-tip: you should never tune your model based on the test set. That’s cheating! Instead, we use a validation set. This is a slice of your training data that you hold back. While the model trains on the training portion, you evaluate its performance on the validation portion after each epoch.
The validation metrics act as a proxy for the test metrics. You watch the validation loss/accuracy to make key decisions:
- Early Stopping: When validation performance stops improving, you stop training to prevent overfitting.
- Hyperparameter Tuning: You can try different model settings (like learning rate or network depth) and pick the one that performs best on the validation set.
Tools like TensorBoard and Weights & Biases are indispensable for visualizing these training and validation curves side-by-side.
🧪 Testing Metrics Uncovered: How to Measure Real-World AI Performance
If training metrics are the practice drills, testing metrics are the Super Bowl. The test set is a pristine, untouched, and representative sample of the data your model will encounter in the wild. It should only be used once, at the very end of your development cycle, to produce a final, unbiased report card on your model.
As the experts at Ultralytics put it, “Model testing checks that the model behaves as expected outside the controlled evaluation environment.” This is the core purpose of the test set.
H3: Why Testing Metrics are the “True” Score
A model’s performance on the test set is its best-estimated performance on new, unseen data. This concept is called generalization, and it’s the holy grail of machine learning. A model that has learned to generalize can take its knowledge from the training data and apply it successfully to novel situations. A high score on the test set means you’ve likely built a robust and useful model.
H3: Beyond the Numbers: The Art of Error Analysis
But a single number, even a test score, doesn’t tell the whole story. The real gold is in qualitative error analysis. After you get your test score, you must dig into the mistakes.
- For a computer vision model: Look at the images it misclassified. Are they all dark? Blurry? Is the object partially hidden? This tells you where your model is weak.
- For a language model: Analyze the prompts where it gave nonsensical or biased answers. This can reveal hidden biases in your training data.
This analysis of why the model failed is often more valuable than the final score itself. It provides a clear roadmap for the next round of improvements.
⚖️ 12 Key Differences Between Training and Testing Metrics You Must Know
Let’s break it down. While they often use the same formulas (e.g., accuracy, F1-score), their context and meaning are worlds apart.
- Core Purpose: Training metrics are for optimization. They guide the model’s learning process. Testing metrics are for evaluation. They measure the model’s final, generalized performance.
- Data Source: Training metrics are calculated on seen data (the training set). Testing metrics are calculated on unseen data (the test set).
- Timing of Use: Training metrics are used during the training loop. Testing metrics are used once, after all training is complete.
- Frequency of Calculation: Training metrics are calculated continuously (e.g., every epoch or batch). Testing metrics are calculated only once.
- Influence on the Model: Training metrics (specifically, the training loss) directly influence the model’s parameters via backpropagation. Testing metrics have zero influence on the model; they are purely for reporting.
- Primary Audience: Training metrics are primarily for the ML engineer and the algorithm itself. Testing metrics are for stakeholders, product managers, and end-users to understand the model’s real-world value.
- The Question They Answer: Training metrics answer, “Is my model learning correctly?” Testing metrics answer, “Has my model learned anything useful?”
- Risk of Misinterpretation: Training metrics can be deceptively high, indicating overfitting. Testing metrics provide a more realistic performance estimate, but can be flawed if the test set doesn’t represent the real world.
- Resulting Action: Poor training metrics lead to debugging the training process. Poor testing metrics lead to a “no-go” decision for deployment and a return to the drawing board (e.g., collecting more data).
- The Role of Validation Metrics: Validation metrics act as a bridge or proxy for test metrics during the development phase, allowing for safe hyperparameter tuning.
- Focus: Training metrics are often focused on a single, optimizable number (the loss function). Testing involves a broader suite of metrics plus qualitative error analysis.
- Relationship to Data Leakage: Poor data hygiene can artificially inflate training and validation metrics. The test set’s performance is what ultimately reveals the devastating impact of that data leakage.
Here’s a quick-reference table to summarize:
| Feature | Training Metrics | Testing Metrics |
|---|---|---|
| Goal | Optimize Model 🛠️ | Evaluate Generalization 🌍 |
| Data | Seen (Training Set) | Unseen (Test Set) |
| When | During Training | After Training |
| Influence | Direct (updates weights) | None (read-only) |
| Key Risk | Hiding Overfitting | Revealing Flaws |
🚦 Overfitting vs. Underfitting: How Metrics Reveal Your Model’s Health
The relationship between your training and testing metrics is the ultimate health check for your model. It’s how you diagnose two of the most common ailments in machine learning: overfitting and underfitting.
Imagine you’re training a model to identify cats in photos.
- Overfitting is like a model that has only ever seen 10 specific photos of your pet cat, Fluffy. It has memorized every pixel of Fluffy. Its training accuracy is 100%! But when you show it a picture of your neighbor’s cat, Mittens (the test set), it has no idea what it’s looking at. It didn’t learn “cat-ness”; it learned “Fluffy-ness.”
- Underfitting is a model that’s too simple. You tried to teach it with a model that can only detect circles. It kind of works for cat faces, but it fails on most training images and almost all test images. It’s just not powerful enough for the task.
H3: Spotting Overfitting with Metric Curves
This is where visualizing your metrics shines. When you plot your training accuracy and your validation/testing accuracy on the same graph over time, overfitting becomes obvious. You’ll see the training accuracy continue to climb, while the validation accuracy plateaus or even starts to drop. That growing gap between the two curves is the signature of overfitting.
H3: The Telltale Signs of Underfitting
Underfitting is simpler to spot. If your model can’t even perform well on the data it’s training on, it’s a non-starter. You’ll see low accuracy on both the training set and the test set. The learning curves will look flat and unimpressive.
Here’s your diagnostic cheat sheet:
| Scenario | Training Metric | Testing Metric | Diagnosis | Solution |
|---|---|---|---|---|
| Good Fit | High & Converged | High & Close to Training | ✅ Just right! | Deploy it! |
| Overfitting | Very High (e.g., 99%) | Significantly Lower (e.g., 75%) | ❌ Memorized the data! | Get more data, use augmentation, add regularization (Dropout, L2). |
| Underfitting | Low (e.g., 60%) | Low (e.g., 58%) | ❌ Too simple! | Use a more complex model, add better features, train longer. |
🔄 Cross-Validation and Its Role in Reliable Model Evaluation
What if, by sheer bad luck, your single test set contained all the hardest examples? Your model’s score would be unfairly low. Or what if it contained only the easiest ones? Your score would be unrealistically high. A single train-test split is vulnerable to this sampling bias.
Enter k-fold cross-validation, a more robust and reliable evaluation technique.
Here’s how it works:
- You shuffle your dataset and split it into k equal-sized chunks (or “folds”). A common choice for k is 5 or 10.
- You perform k rounds of training and evaluation.
- In each round, you hold out one fold as the test set and train your model on the remaining k-1 folds.
- You end up with k different evaluation scores, one from each fold.
The final performance metric is the average of these k scores. This gives you a much more stable and trustworthy estimate of your model’s performance. The Nature paper highlights this, stating, “While the test sets should ideally come from fully different data sets, sometimes our only option is to use a resampling procedure to create multiple test sets from the same data.” Cross-validation is the most common and respected of these resampling procedures. It’s the gold standard for academic papers and for competitions on platforms like Kaggle.
🛠️ Preparing Your Dataset: Avoiding Data Leakage for Honest Metrics
Data leakage is the silent killer of machine learning projects. It happens when information from outside the training dataset—typically from your validation or test set—contaminates the training process. It’s like a student finding the final exam questions and answers ahead of time. They’ll get a perfect score, but have they learned anything? Absolutely not.
We once had a project here at ChatBench.org™ to predict customer churn. The model was unbelievably accurate—over 98%! We were ready to celebrate until a junior engineer pointed out a feature called days_since_last_contact. For churned customers, this value was often very high, but for active customers, it was calculated based on data from after the prediction date. The model wasn’t predicting churn; it was just identifying customers who had already left based on future information! 🤦♂️ A classic case of data leakage.
The Ultralytics documentation lists several common types of leakage in computer vision, such as camera bias (one camera used for all “sick” patients) or overlay bias (text or markers appearing only on one class of images).
How to Avoid This Catastrophe:
- ✅ Strict Physical Separation: Keep your
train,validation, andtestdata in completely separate folders. Never shall the three meet until the appointed time. - ✅ Split First, Process Later: Perform your train-test split before doing any feature engineering or preprocessing. If you need to scale your data (e.g., normalization), calculate the scaling parameters (like mean and standard deviation) only from the training set. Then, apply that same scaling to your validation and test sets.
- ✅ Be Wary of Time: For time-series data, the golden rule is to always validate and test on data that comes after your training data. You can’t use Friday’s stock prices to “predict” Wednesday’s.
📊 Choosing the Right Metrics for Classification, Regression, and Beyond
There is no single “best” metric. The right choice depends entirely on your project’s goals and the type of problem you’re solving. Using the wrong metric is like judging a fish by its ability to climb a tree.
H3: For Classification Problems (Is it A, B, or C?)
This is where you’re sorting items into categories. Our Model Comparisons often hinge on these.
- Accuracy: The go-to for balanced datasets where every class is equally important.
- Precision, Recall, F1-Score: Your toolkit for imbalanced datasets. As Evidently AI wisely advises, “Mind the cost of error.” If false positives are costly (e.g., a spam filter blocking an important email), optimize for Precision. If false negatives are costly (e.g., missing a fraudulent transaction), optimize for Recall. The F1-Score is their diplomatic child, seeking balance.
- AUC (Area Under the ROC Curve): A great overall measure for binary classifiers that shows how well the model separates the classes, independent of the classification threshold.
H3: For Regression Problems (How much or how many?)
Here, you’re predicting a continuous value, like a price or temperature.
- MAE (Mean Absolute Error): The average absolute difference between predicted and actual values. It’s easy to interpret and less sensitive to wild outliers.
- MSE (Mean Squared Error) & RMSE (Root Mean Squared Error): MSE squares the errors before averaging, so it heavily penalizes large errors. RMSE brings the unit back to the original by taking the square root, making it more interpretable.
- R-squared (R²): Tells you the proportion of the variance in the dependent variable that is predictable from the independent variable(s).
H3: For Computer Vision Tasks (What is in this image and where?)
Tasks like object detection with models like Ultralytics YOLO have their own specialized metrics.
- IoU (Intersection over Union): Measures the overlap between the predicted bounding box and the ground-truth bounding box. It’s the fundamental metric for localization accuracy.
- mAP (mean Average Precision): The king of object detection metrics. It calculates the average precision across all classes and various recall levels, providing a single, comprehensive score for a model’s performance.
🤖 Real-World Examples: How Industry Leaders Use Training and Testing Metrics
Theory is great, but let’s see how the pros put these concepts into practice.
-
📺 Netflix’s Recommendation Engine: Netflix doesn’t just care if you watch a movie; they want to predict how much you’ll like it. They use regression metrics like RMSE (Root Mean Squared Error) to evaluate how close their predicted star ratings are to your actual ratings. Their “test set” is constantly updating: it’s you, the new user, and the new content that just dropped. Their training metrics guide the model’s learning on historical data, but the testing metrics on live user interactions determine if an algorithm change gets rolled out globally.
-
🚗 Tesla’s Autopilot: This is high-stakes AI. Tesla uses a suite of computer vision metrics for its self-driving features. mAP and IoU are critical for detecting other cars, pedestrians, and lane lines. But their “testing” is on another level. They use “shadow mode,” where the AI runs silently in their entire fleet of customer cars. It makes predictions (e.g., “I would turn the wheel now”), but doesn’t act on them. These predictions are sent back to Tesla and compared against the actions of the human driver. This creates a massive, continuous testing loop on real-world data, allowing them to measure performance and find edge cases at an incredible scale.
-
🔍 Google Search: When you type a query, Google’s models are performing an information retrieval task. They use metrics like Precision@k (How many of the top k results are relevant?) and NDCG (Normalized Discounted Cumulative Gain), which rewards models for putting the most relevant results at the very top of the page. Their “test set” is the live fire of billions of daily searches. They use A/B testing to roll out new algorithms to a small percentage of users, and if the testing metrics (like user clicks and engagement) improve, the change is rolled out to everyone.
🔍 Visualizing Metrics: Tools and Techniques to Track Model Performance
A number is just a number. A graph tells a story. Visualizing your training and testing metrics is non-negotiable for any serious ML project.
- Learning Curves: As we’ve discussed, plotting training vs. validation loss/accuracy over epochs is the #1 way to diagnose overfitting and underfitting.
- Confusion Matrix: For any classification problem, this is your best friend. It’s a simple grid that shows you exactly what your model is getting right and where it’s getting confused. It breaks down predictions into True Positives, True Negatives, False Positives, and False Negatives, making it easy to see if you have a problem with a specific class.
- ROC Curve (Receiver Operating Characteristic): For binary classifiers, this curve plots the True Positive Rate against the False Positive Rate at various threshold settings. A model that’s no better than random guessing will have a line straight through the middle. A perfect model will hug the top-left corner. The Area Under this Curve (AUC) is a key summary metric.
Essential Tools for Your MLOps Stack:
- TensorBoard: The classic visualization toolkit from the TensorFlow team, but it integrates well with PyTorch too. It’s free, open-source, and a great starting point.
- Weights & Biases (W&B): A more powerful, cloud-based platform for experiment tracking. It automatically logs metrics, hyperparameters, and even model checkpoints, making it easy to compare dozens of runs.
- Evidently AI: An open-source Python library specifically designed to create beautiful and insightful performance reports and dashboards for your models, both in testing and in production.
- MLflow: An open-source platform from Databricks to manage the entire ML lifecycle, including experiment tracking, model packaging, and deployment.
👉 Shop ML Experimentation Platforms on: Paperspace | RunPod | DigitalOcean
🧩 Beyond Accuracy: Exploring Precision, Recall, F1 Score, and More
Let’s get personal with the metrics that matter most when accuracy isn’t enough. Imagine you’re building an AI model to help doctors detect a rare, aggressive form of cancer. The dataset is highly imbalanced—99.9% of tissue samples are benign.
H3: The Cancer Detection Dilemma: A Tale of Two Costs
You train two models.
-
Model A (The Cautious One): This model is optimized for Precision. Precision answers the question: “Of all the times the model cried ‘Cancer!’, how often was it right?” Model A has extremely high precision. If it flags a sample, the doctor can be very confident it’s malignant. The downside? It’s so cautious that it might miss some subtle, early-stage cases. It has low Recall. The cost of a False Positive (telling a healthy person they might have cancer) is high (stress, unnecessary biopsies), so this model minimizes that.
-
Model B (The Vigilant One): This model is optimized for Recall. Recall answers the question: “Of all the patients who truly had cancer, how many did the model correctly identify?” Model B is designed to never miss a case. It has very high recall. The downside? It’s over-sensitive and flags many benign samples as potentially cancerous, leading to many false alarms. The cost of a False Negative (missing a real cancer case) is catastrophic, so this model minimizes that.
Which model is better? It’s not a technical question; it’s a product and ethical one. This is the Precision-Recall tradeoff.
H3: The F1-Score: The Great Compromise
You can’t always have it both ways. The F1-Score is the harmonic mean of Precision and Recall. It seeks a balance between the two. If you need a single number to compare models that considers both types of errors, the F1-Score is your metric. It’s particularly useful when you have an uneven class distribution.
📈 Monitoring AI Models Post-Deployment: Why Testing Metrics Still Matter
So, your model passed the test set with flying colors and you’ve deployed it to production. Job done, right? Not even close.
The world is not static. Customer behavior changes, new types of data emerge, and what was a representative dataset last year might be obsolete today. This phenomenon is called model drift or concept drift, and it can silently degrade your model’s performance over time.
This is why the concept of “testing” must extend into the production environment through continuous monitoring.
How to Monitor Your Deployed AI:
- Track Prediction Performance: You need a system to log your model’s live predictions and, when possible, compare them to the actual outcomes (the “ground truth”). For a product recommendation model, this could be tracking whether a user actually clicks on or buys the recommended item. You can then calculate your key testing metrics (Precision, Recall, etc.) on a rolling basis (e.g., daily or weekly).
- Monitor for Data Drift: Even without ground truth, you can monitor the statistical properties of the data being fed into your model. Is the average value of a feature suddenly much higher than it was in the training set? Are you seeing new categories in a feature that never existed before? Significant changes in the input data distribution are a massive red flag that your model’s performance is likely degrading.
This is a core tenet of MLOps (Machine Learning Operations). Specialized tools like Arize AI, Fiddler AI, and the open-source Evidently AI are built specifically to tackle the challenges of model monitoring, alerting you when your AI’s performance starts to slip.
💡 Tips to Improve Your Model Based on Training and Testing Metric Insights
Your metrics aren’t just a grade; they’re a diagnostic report. Here’s a quick guide to turning those numbers into actionable steps.
| Your Metric Observation | The Likely Diagnosis | What to Try Next |
|---|---|---|
| 📉 Low Training Accuracy & Low Test Accuracy | Underfitting (Model is too simple) | 1. Use a more powerful model (e.g., deeper neural network). 2. Engineer better features. 3. Train for more epochs. 4. Decrease regularization. |
| 📈 High Training Accuracy & 📉 Low Test Accuracy | Overfitting (Model memorized, didn’t learn) | 1. Get more data! (The #1 cure). 2. Use data augmentation (e.g., rotating, flipping images). 3. Add regularization (e.g., Dropout, L1/L2). 4. Use a simpler model. |
| ✅ High Test Accuracy, but fails on a specific group (e.g., low-light images) | Data Bias / Edge Case Failure | 1. Collect more data specifically for that underperforming slice. 2. Use stratified sampling to ensure that group is represented. 3. Check for hidden biases in your data. |
| Precision is High, but Recall is Low | Model is too cautious, missing positive cases. | 1. Lower the model’s decision threshold. 2. Use class weighting to give more importance to the positive class during training. 3. Re-evaluate your features. |
| Recall is High, but Precision is Low | Model is too trigger-happy, creating false alarms. | 1. Raise the model’s decision threshold. 2. Collect more data that helps distinguish the negative class. 3. Add features that specifically target the cause of false positives. |
🌐 Join the AI Metrics Conversation: Communities and Resources
Mastering AI evaluation is a journey, not a destination. The best way to learn is to engage with the community, ask questions, and see how others are solving similar problems.
- Kaggle: The premier platform for machine learning competitions. There is no better place to see how different evaluation metrics play out in practice and to read discussions from top data scientists.
- Ultralytics Discord Server: A must-join for anyone working in computer vision. It’s a vibrant community for discussing models like YOLO, sharing results, and getting help.
- Reddit’s r/MachineLearning: A massive and active community for news, research papers, and discussions on all things ML.
And, of course, the conversation continues right here at ChatBench.org™! Dive into our other articles on LLM Benchmarks and Model Comparisons to stay on the cutting edge. What are your go-to metrics? Share your war stories in the comments below!
📝 In Summary: Mastering Training vs. Testing Metrics for AI Success
If you take away just one thing from this deep dive, let it be this: Training metrics tell you if your model is learning, while testing metrics tell you if your model has learned anything useful.
The first guides your optimization process, helping you debug and tune your model. The second is your final, unbiased judgment, telling you whether your model is ready for the real world. Neglecting the distinction between them is the fastest path to building an AI that looks brilliant in the lab and fails spectacularly in reality.
Building trustworthy, effective AI requires a disciplined, holistic approach to evaluation. It means choosing the right metrics for your specific problem, being vigilant against overfitting and data leakage, and understanding that a single number never tells the whole story. By mastering the art and science of training and testing metrics, you’re not just building better models—you’re building the future of AI on a foundation of rigor and truth.
🎯 Conclusion

We’ve journeyed through the fascinating landscape of training and testing metrics—the twin pillars of AI model evaluation. From understanding how training metrics act as your model’s learning diary to appreciating testing metrics as the ultimate real-world exam, the distinction is crucial. Without this clarity, you risk building models that shine in the lab but stumble in production.
We also explored the many nuances: the perils of overfitting and underfitting, the importance of avoiding data leakage, and the art of choosing the right metrics tailored to your problem—whether classification, regression, or computer vision. We saw how industry giants like Netflix, Tesla, and Google rely on these principles to keep their AI systems robust and trustworthy.
Remember the unresolved question we hinted at early on: Why do training metrics sometimes look fantastic while testing metrics tell a different story? Now you know—the answer lies in generalization and the model’s ability to apply learned knowledge to unseen data. This is the ultimate test of AI success.
By mastering these concepts and integrating rigorous evaluation practices, you’re not just building better AI—you’re building AI you can trust.
Happy modeling! 🚀
🔗 Recommended Links for Deep Dives on AI Model Evaluation
Ready to level up your AI evaluation game? Check out these essential resources and tools:
- TensorBoard: https://www.tensorflow.org/tensorboard
- Weights & Biases: https://wandb.ai/site
- Evidently AI: https://www.evidentlyai.com/
- Ultralytics YOLO Official: https://ultralytics.com/
- Kaggle Competitions: https://www.kaggle.com/
- Arize AI (Model Monitoring): https://arize.com/
- Fiddler AI (Model Monitoring): https://www.fiddler.ai/
👉 Shop ML Experimentation Platforms on:
- Paperspace: https://www.paperspace.com/gradient/enterprise |
- RunPod: https://www.runpod.io/serverless-gpu |
- DigitalOcean: https://www.digitalocean.com/products/paperspace
Recommended Books on AI Model Evaluation:
- “Hands-On Machine Learning with Scikit-Learn, Keras, and TensorFlow” by Aurélien Géron — Amazon
- “Pattern Recognition and Machine Learning” by Christopher Bishop — Amazon
- “Machine Learning Yearning” by Andrew Ng (Free PDF) — Official site
❓ FAQ: Your Burning Questions About Training and Testing Metrics Answered

How do training metrics impact the accuracy of AI model predictions in real-world applications?
Training metrics provide immediate feedback on how well your model is learning from the training data. They guide hyperparameter tuning, model architecture choices, and optimization strategies. However, high training accuracy alone does not guarantee good real-world performance because the model may overfit—memorizing training examples rather than learning generalizable patterns. Therefore, while training metrics are essential for model development, they must be interpreted alongside validation and testing metrics to ensure the model will perform well on unseen data.
What are the most important testing metrics to consider when evaluating the performance of a machine learning model?
The choice depends on the problem type and business goals:
- Classification: Accuracy, Precision, Recall, F1-Score, and AUC-ROC are critical. For imbalanced datasets, Precision and Recall often provide more insight than Accuracy alone.
- Regression: Mean Absolute Error (MAE), Mean Squared Error (MSE), Root Mean Squared Error (RMSE), and R² score are standard.
- Computer Vision: Intersection over Union (IoU), mean Average Precision (mAP), and Dice coefficient matter.
Testing metrics provide an unbiased estimate of how the model will perform in production, making them indispensable for deployment decisions.
Can overfitting or underfitting occur if training and testing metrics are not properly balanced during AI model development?
✅ Absolutely. Overfitting occurs when a model performs exceptionally well on training data but poorly on testing data, indicating it has memorized noise or irrelevant patterns. Underfitting happens when the model performs poorly on both training and testing data, signaling it is too simplistic to capture underlying trends. Balancing training and testing metrics through techniques like cross-validation, regularization, and proper data splitting is essential to avoid these pitfalls.
What role do validation metrics play in bridging the gap between training and testing phases to ensure reliable AI model evaluation?
Validation metrics act as a proxy for testing metrics during model development. They allow you to tune hyperparameters and make decisions without touching the test set, preserving the test set’s integrity as an unbiased evaluation. Validation helps detect overfitting early by showing when performance on unseen data stops improving, enabling techniques like early stopping. Without validation metrics, you risk “peeking” at the test data and inflating your model’s perceived performance.
How can data leakage be detected and prevented during AI model evaluation?
Data leakage can be detected by suspiciously high training or validation metrics that do not translate to test or production performance. Techniques include:
- Careful review of data collection and preprocessing pipelines.
- Ensuring strict separation of training, validation, and test sets.
- Using feature importance analysis to spot features that leak target information.
- Visual inspection of data samples for hidden biases.
Prevention involves rigorous data hygiene, splitting data before preprocessing, and domain expertise to identify potential leakage sources.
Why is statistical testing important when comparing AI models based on evaluation metrics?
Statistical tests (e.g., Wilcoxon signed-rank, McNemar’s test, DeLong test) help determine whether observed differences in model performance metrics are statistically significant or due to random chance. This is crucial when improvements are marginal and helps avoid deploying models based on spurious gains. The Nature article emphasizes that non-parametric tests are often preferred for machine learning model comparisons, especially with resampled data.
📚 Reference Links and Further Reading on AI Model Metrics
- Ultralytics YOLO Model Testing Guide: https://docs.ultralytics.com/guides/model-testing/
- Evidently AI Classification Metrics: https://www.evidentlyai.com/classification-metrics/accuracy-precision-recall
- Nature Scientific Reports on Evaluation Metrics and Statistical Tests: https://www.nature.com/articles/s41598-024-56706-x
- TensorFlow TensorBoard: https://www.tensorflow.org/tensorboard
- Weights & Biases Experiment Tracking: https://wandb.ai/site
- Kaggle Machine Learning Competitions: https://www.kaggle.com/
- Arize AI Model Monitoring: https://arize.com/
- Fiddler AI Explainability & Monitoring: https://www.fiddler.ai/
- Ultralytics Official Website: https://ultralytics.com/
By grounding your AI evaluation practices in these trusted resources and tools, you’ll be well-equipped to build models that not only perform well on paper but also deliver real-world value.
Thank you for reading! For more expert insights and cutting-edge AI benchmarks, keep exploring ChatBench.org™.